Fig. 6
Download original image
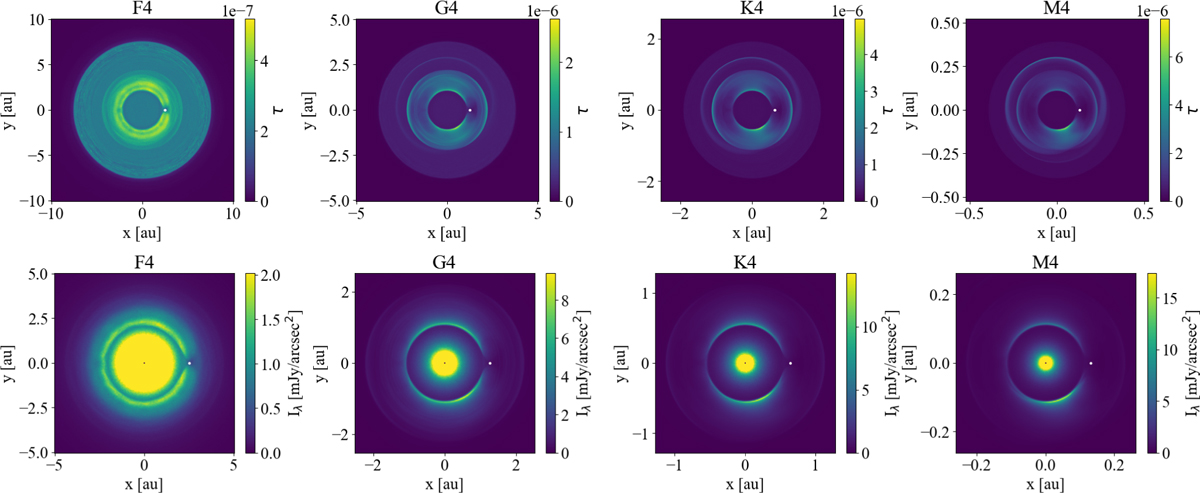
Distributions of optical depth (upper row) and surface brightness (10 μm; lower row) for spectral types F4, G4, K4, and M4, from left to right, assuming a constant τBG ∼ 3 zodis. The star is located at the center of the distributions, and the planet is marked with a white dot to the right of the central star. The spatial scale differs between the upper and lower panels: the optical depth maps show a larger region (∼4 ap) to capture the full disk structure, while the surface brightness provides a zoom-in on a smaller region (∼2 ap) around the planet to emphasize resonant ring structures. All panels have a consistent bin size of ap/50 × ap/50. The color bars vary across spectral types to optimize visualization. For reference, the optical depth at r ∼ 2 ap is τBG ≈ 2.1 × 10⁻⁷ for all spectral types. The inner regions of the surface brightness maps are saturated above the ring maximum and excluded within the sublimation distance. The spatial scale also varies with spectral type, with lower-mass stars having more compact configurations. These results correspond to Model II only, as they are from the main study. Note that we derive our results from grain sizes of 0.1-300 μm and may differ if larger grains are included (see Sect. 4.5).
Current usage metrics show cumulative count of Article Views (full-text article views including HTML views, PDF and ePub downloads, according to the available data) and Abstracts Views on Vision4Press platform.
Data correspond to usage on the plateform after 2015. The current usage metrics is available 48-96 hours after online publication and is updated daily on week days.
Initial download of the metrics may take a while.