Fig. 9
Download original image
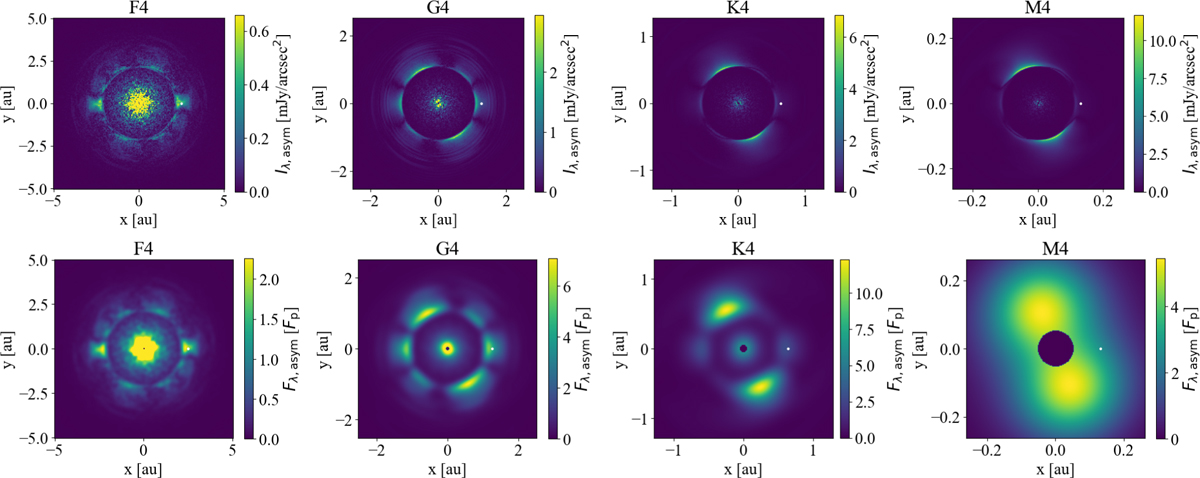
Asymmetric surface brightness (10 μm; upper row), and corresponding flux per beam relative to the planet flux Fp (lower row), following the format of Fig. 6. The inner regions are saturated above the ring maximum, and all maps are shown within a spatial scale of ∼2 ap. The asymmetric surface brightness maps here follow the approach of Fig. 11 in Defrère et al. (2010). The area within the IWA is masked in the flux per beam maps, assuming d = 10 pc and B = 100 m. For reference, the beam FWHM (λ/B ≈ 0.2 au) is about twice the diameter of the IWA mask.
Current usage metrics show cumulative count of Article Views (full-text article views including HTML views, PDF and ePub downloads, according to the available data) and Abstracts Views on Vision4Press platform.
Data correspond to usage on the plateform after 2015. The current usage metrics is available 48-96 hours after online publication and is updated daily on week days.
Initial download of the metrics may take a while.