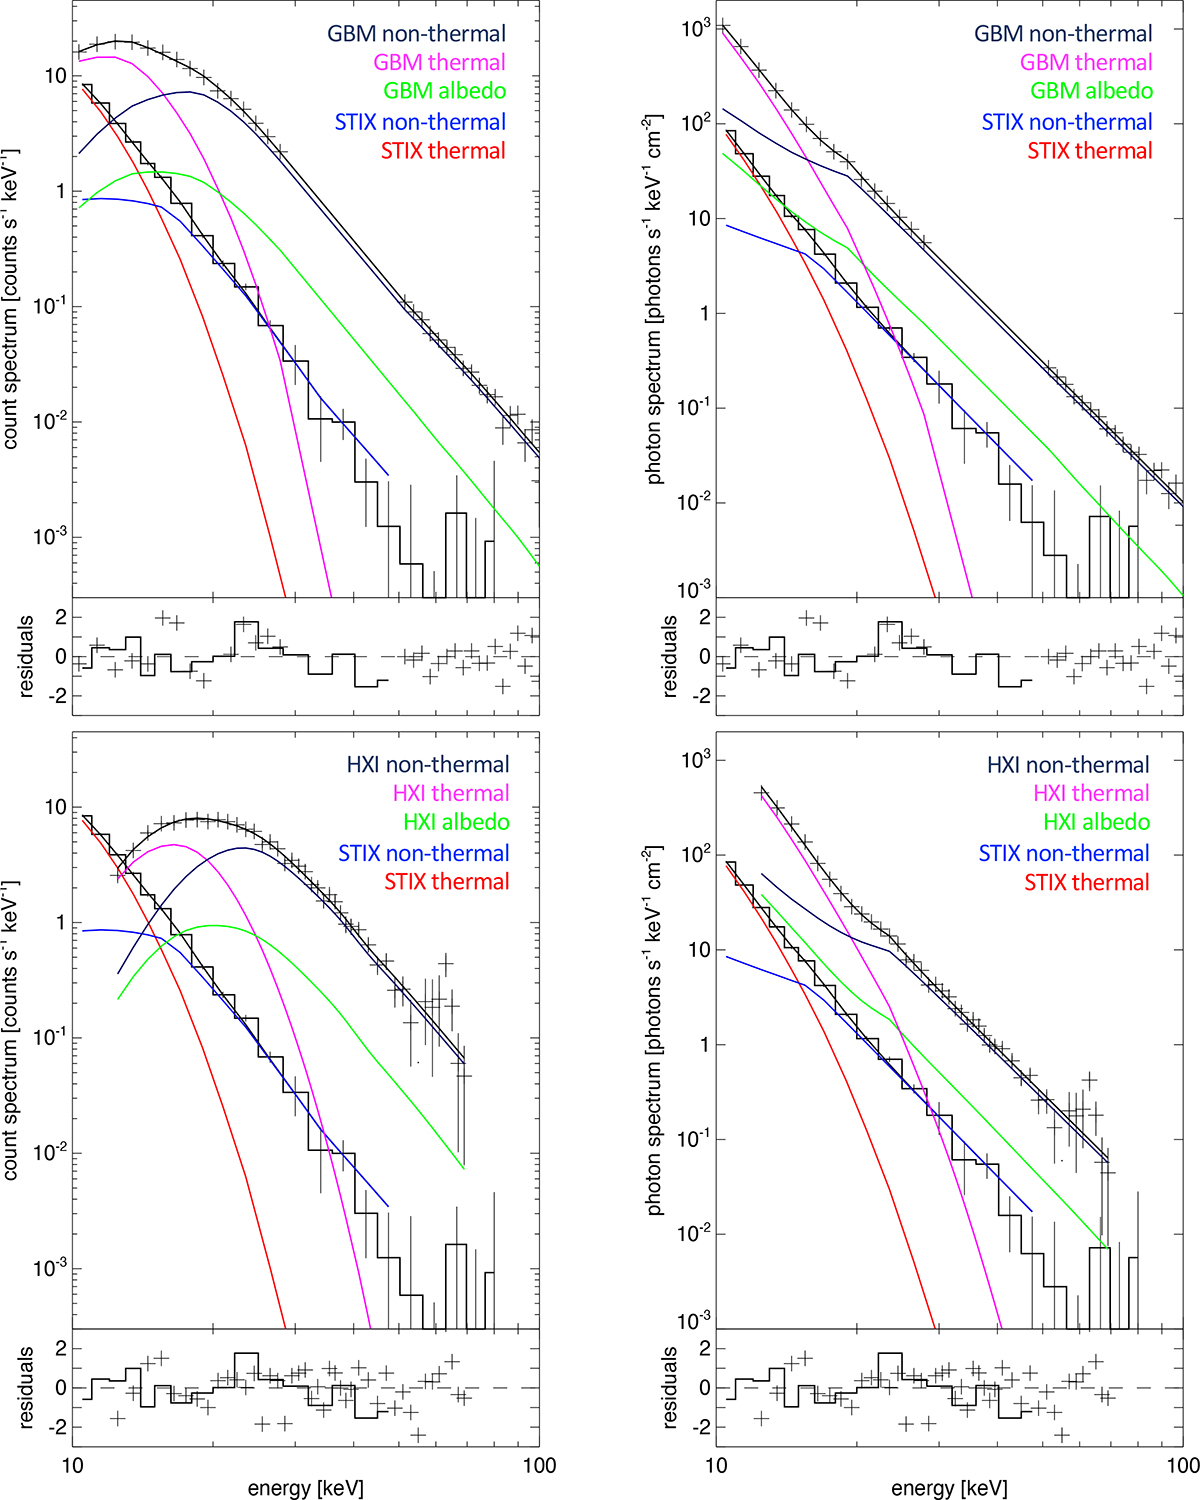
Fig. 3.
Download original image
Spectral fitting results for the first hard X-ray peak (06:52:43.1 to 06:52:57.5UT at Earth). The two plots on the top compare STIX with GBM, while the two plots on the bottom compare STIX with HXI. The STIX spectrum is shown in histogram style, while the other two are shown by crosses. For each comparison the count spectrum as well as the photon spectra are shown. Individual fit components are shown in color as indicated by the annotation.
Current usage metrics show cumulative count of Article Views (full-text article views including HTML views, PDF and ePub downloads, according to the available data) and Abstracts Views on Vision4Press platform.
Data correspond to usage on the plateform after 2015. The current usage metrics is available 48-96 hours after online publication and is updated daily on week days.
Initial download of the metrics may take a while.