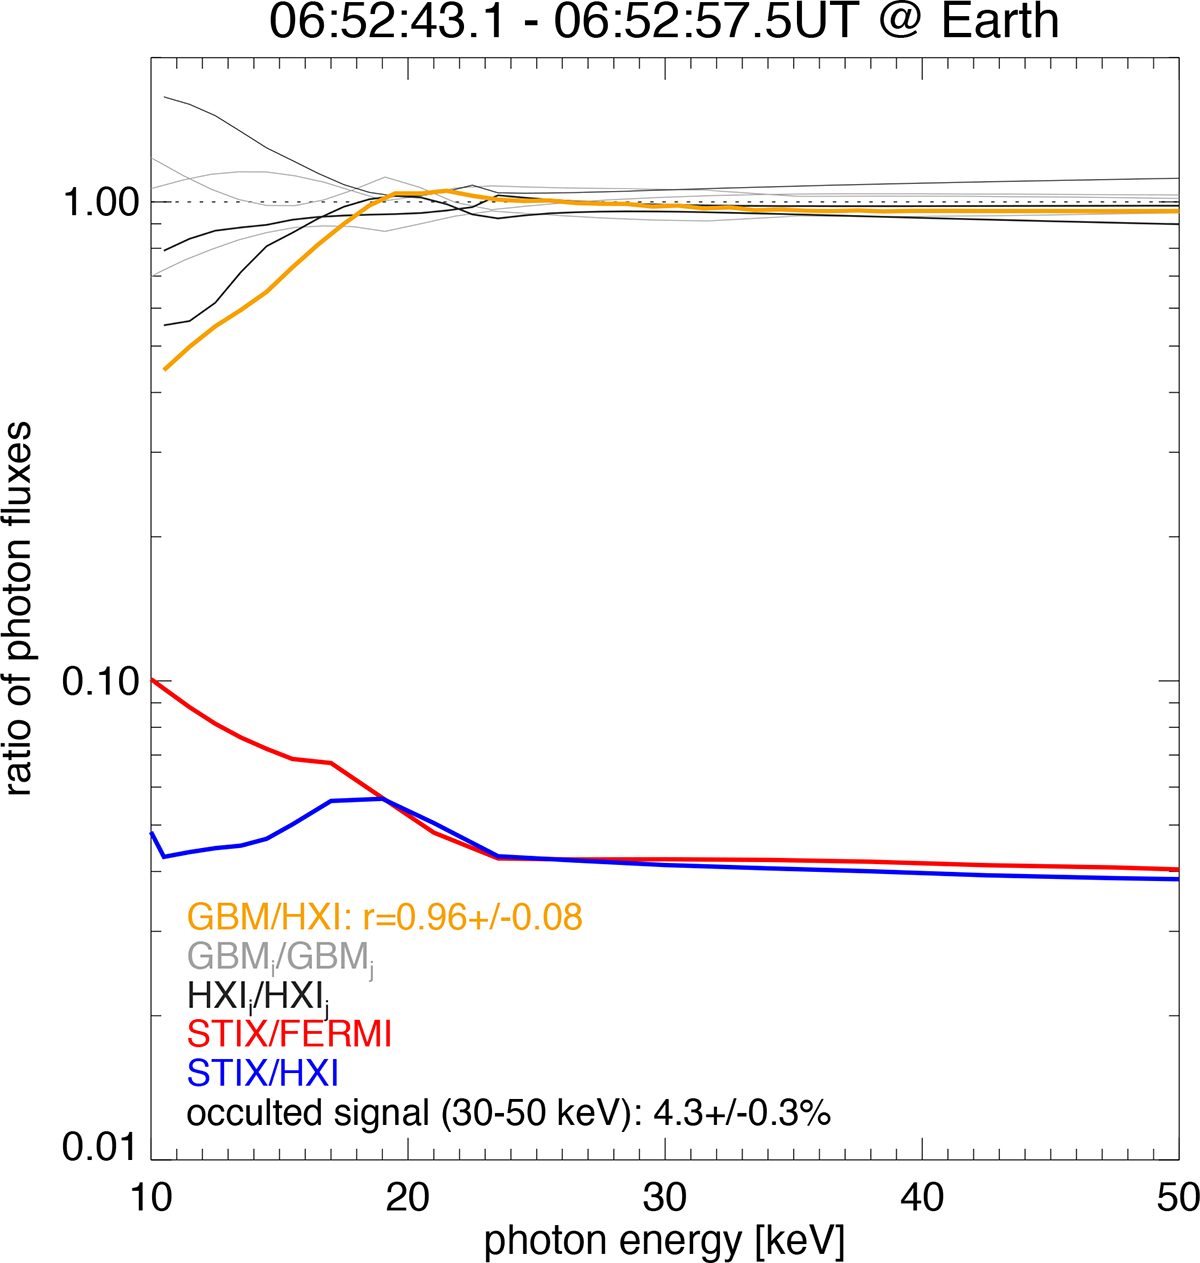
Fig. 4.
Download original image
Comparison of the GMB, HXI, and STIX photon spectra shown in Fig. 3. The thin gray and black lines give ratios of individual detector pairs for HXI and GBM, respectively, while the orange curve represents the ratio between the averaged GBM and HXI photon spectra. As GBM and HXI both see the full flare emission, the ratio should be 1 for perfectly calibrated instruments. Above 20 keV, the ratio is close to unity indicating a satisfactory state of the calibration has been achieved to date. At lower energy, the deviations from unity are significant reflecting that these low energies are much more difficult to calibrate. As STIX detects only part of the total flare signal due to occultation, a ratio of less than one is expected. The ratio above 20 keV is observed to be around 4%. Surprisingly, the ratio stays constant with energy indicating the same spectral shape for the high-coronal sources as for the total flare.
Current usage metrics show cumulative count of Article Views (full-text article views including HTML views, PDF and ePub downloads, according to the available data) and Abstracts Views on Vision4Press platform.
Data correspond to usage on the plateform after 2015. The current usage metrics is available 48-96 hours after online publication and is updated daily on week days.
Initial download of the metrics may take a while.