Fig. 5.
Download original image
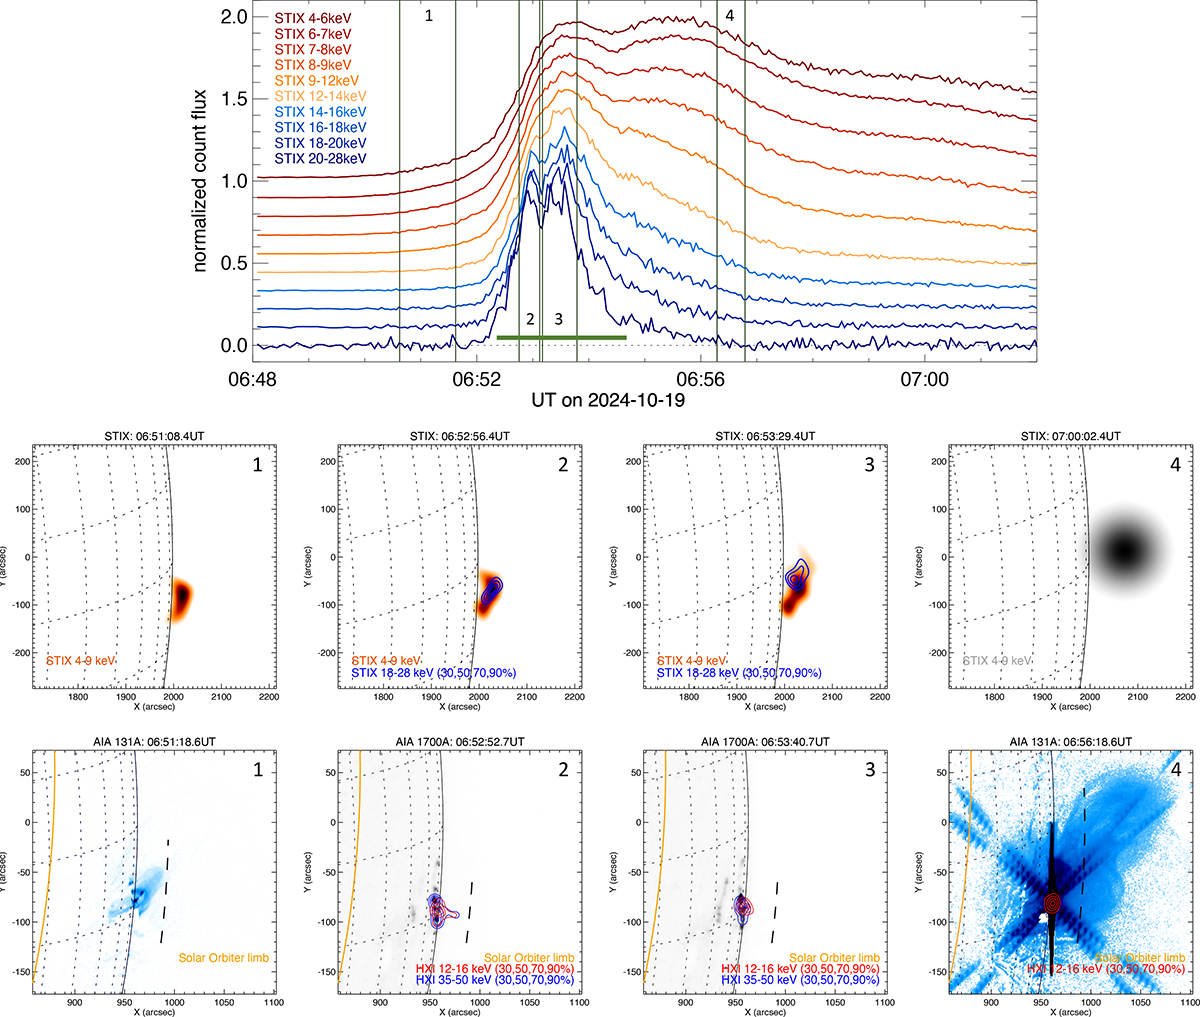
Imaging results from STIX (center row) and from HXI and AIA (bottom row) for four intervals during the flare. The top plot shows the STIX X-ray profiles (normalized and stacked for a clearer display) with the four time intervals marked by numbers. The fields of view of the images have been adjusted to display the same projected area on the Sun to take into account the closer distance of Solar Orbiter to the Sun. The second and fourth time intervals are the same as the ones used in Fig. 1.
Current usage metrics show cumulative count of Article Views (full-text article views including HTML views, PDF and ePub downloads, according to the available data) and Abstracts Views on Vision4Press platform.
Data correspond to usage on the plateform after 2015. The current usage metrics is available 48-96 hours after online publication and is updated daily on week days.
Initial download of the metrics may take a while.