Open Access
Fig. 2.
Download original image
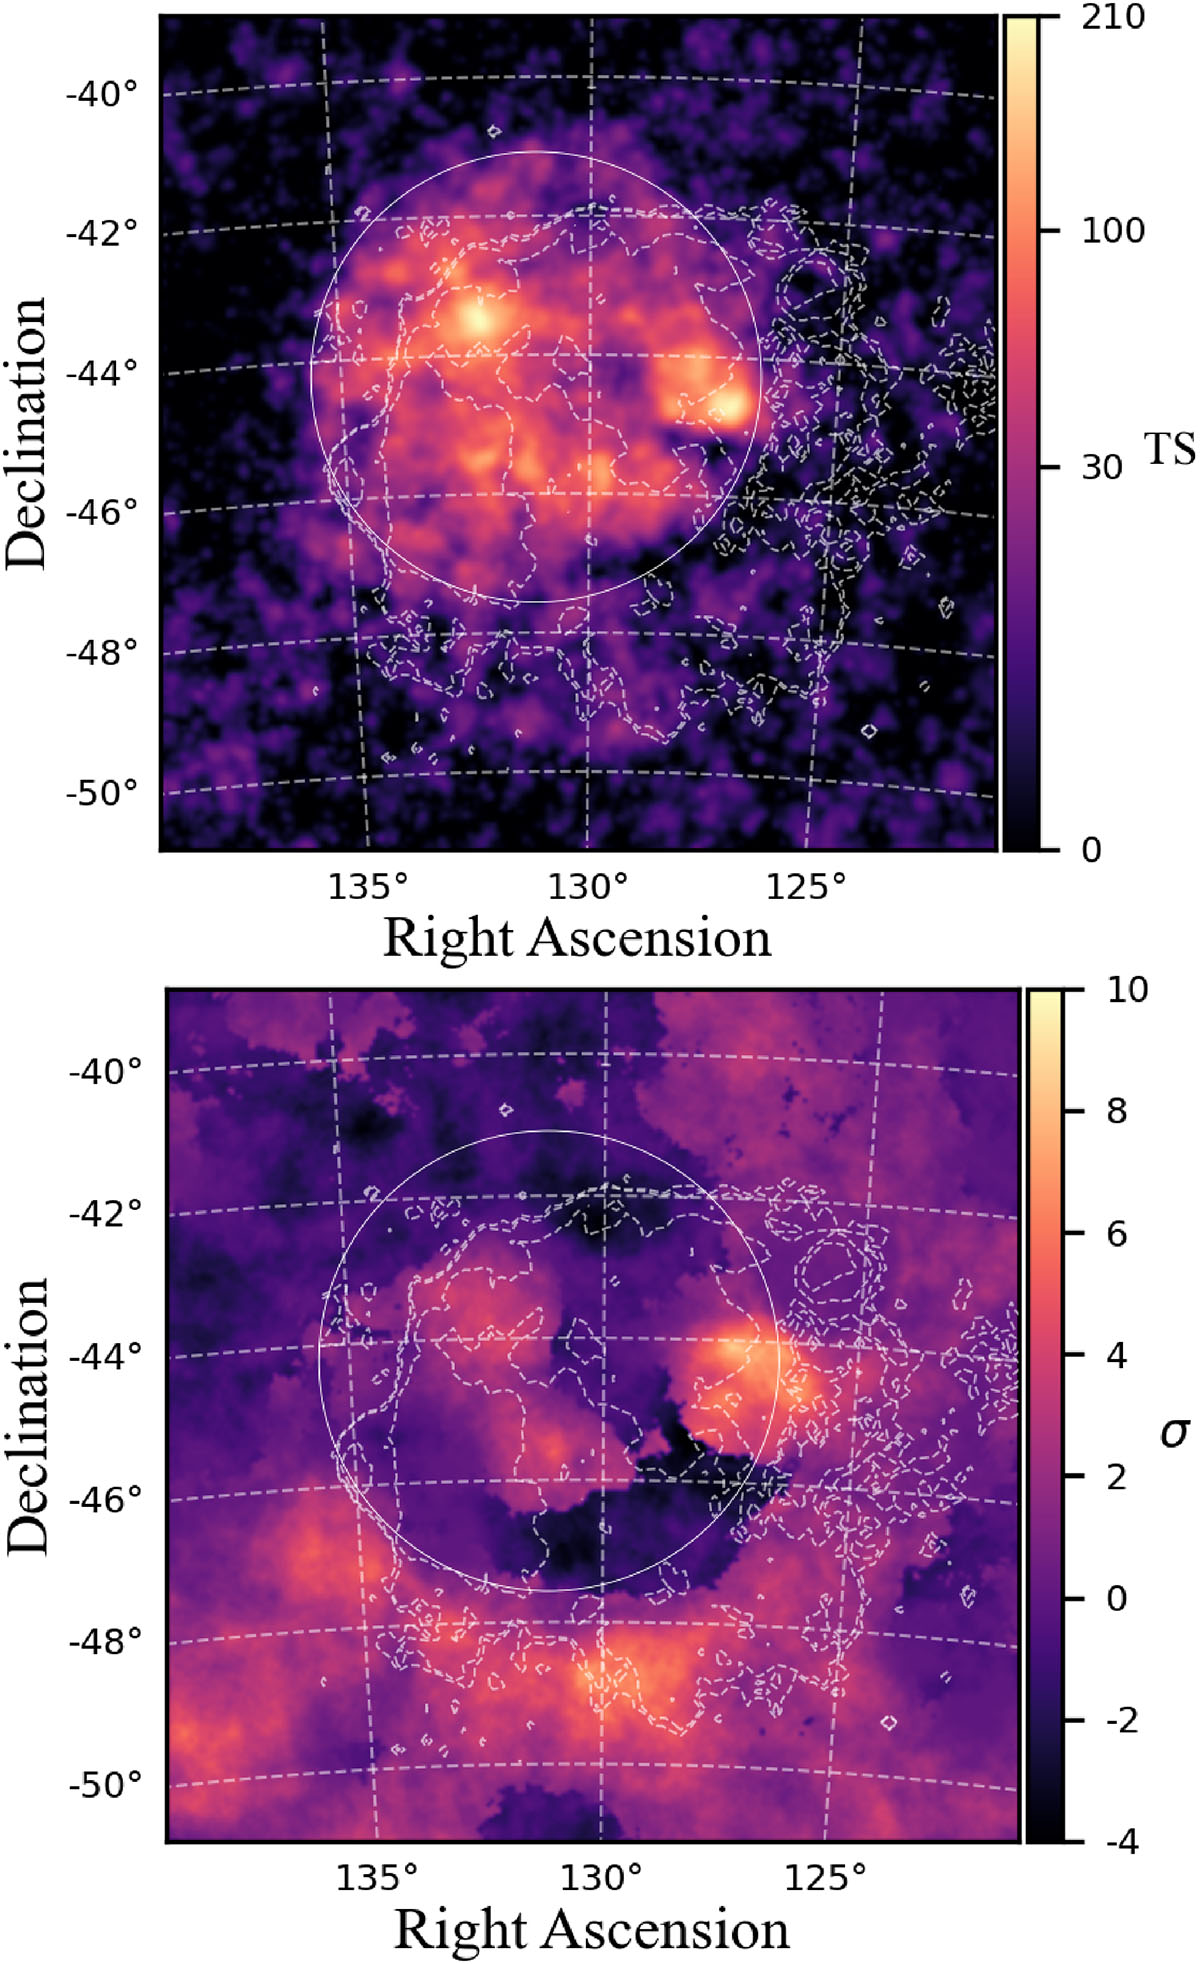
Top: TS map of the Vela region in the energy range 1 − 100 GeV (note that the scale is not linear). Bottom: Residual PS map (see text). For both maps the contours are the same as in Fig. 1 and the large circle represents the disk found in this work.
Current usage metrics show cumulative count of Article Views (full-text article views including HTML views, PDF and ePub downloads, according to the available data) and Abstracts Views on Vision4Press platform.
Data correspond to usage on the plateform after 2015. The current usage metrics is available 48-96 hours after online publication and is updated daily on week days.
Initial download of the metrics may take a while.