Fig. 7
Download original image
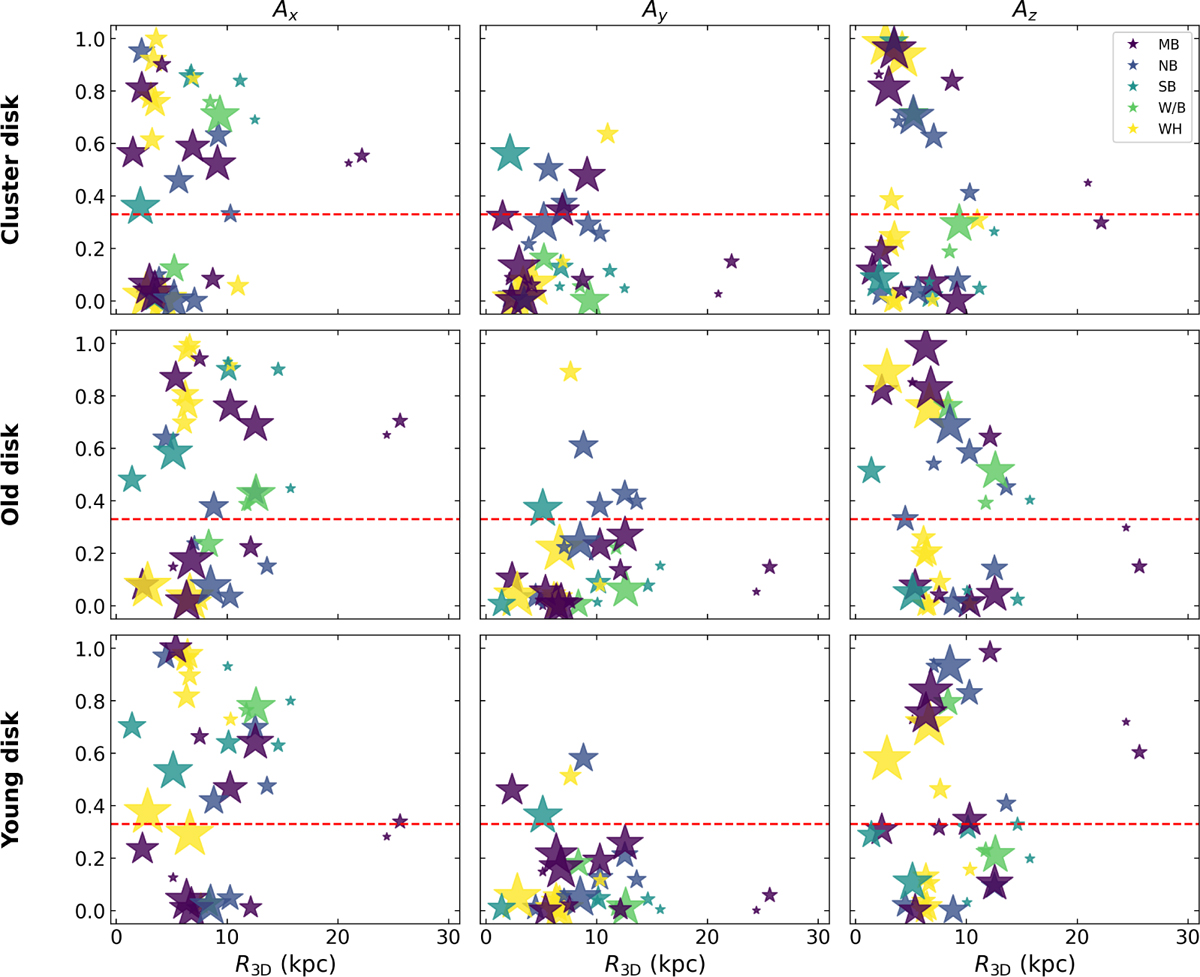
Distribution of Ax, Ay, and Az as a function of distance from the SMC center (R3D). Anisotropy was estimated for each of the models studied in Piatti (2026). Top: cluster disk model (Piatti 2021a). Middle: old disk model (age >2 Gyr). Bottom: young disk model (age < 50 Myr). Star clusters pertaining to different substructures (Dias et al. 2016) are drawn in different colors, as indicated in the top-right panel. The red line (Ai = 0.33, i = x, y, z) represents the expected value for an isotropic motion. The symbol sizes are proportional to Neff.
Current usage metrics show cumulative count of Article Views (full-text article views including HTML views, PDF and ePub downloads, according to the available data) and Abstracts Views on Vision4Press platform.
Data correspond to usage on the plateform after 2015. The current usage metrics is available 48-96 hours after online publication and is updated daily on week days.
Initial download of the metrics may take a while.