Fig. 1.
Download original image
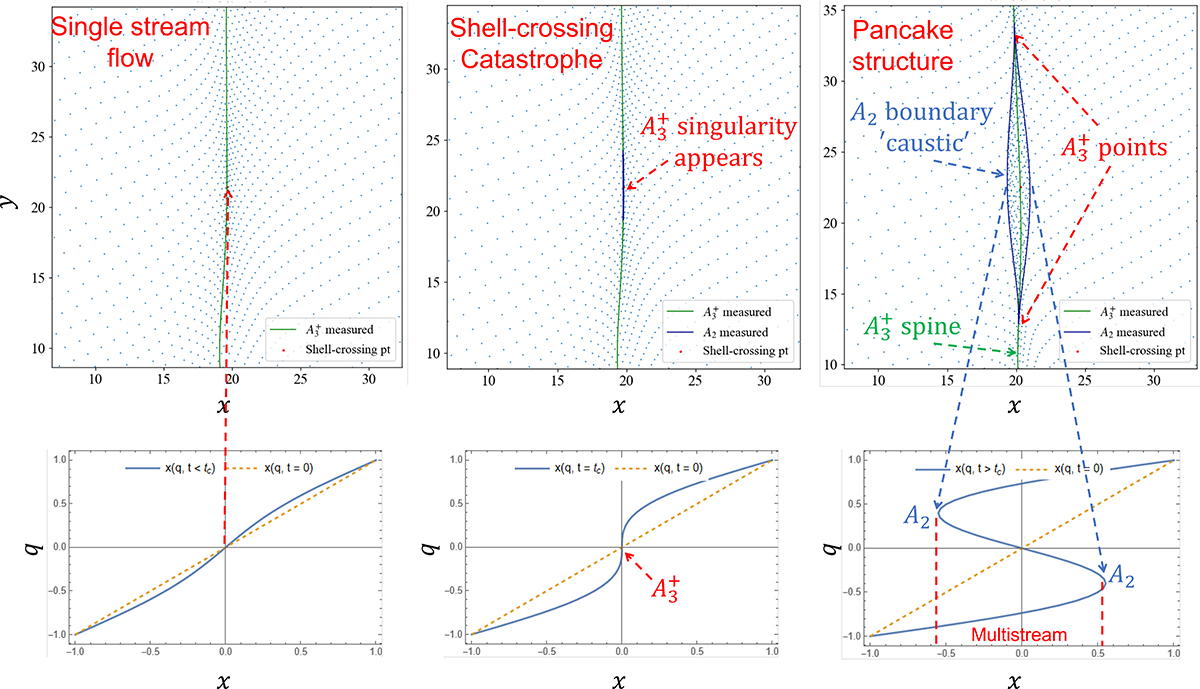
2D shell crossing in Eulerian x − y space (top row) along with a qx axis slice through the shell-crossing point qc in qx − x space (bottom row) to help visualize the folding of the CDM sheet. Left column: Snapshot during the single-stream flow prior to shell crossing (t < tc). Middle column: Moment of shell crossing (t = tc). A catastrophe event marked by the appearance of an A3+ singularity (red dot) seeds the 2D pancake-like structure, shown in the right column (t > tc). The boundary of the pancake encompassing the multi-streaming region is defined by A2 singularities (blue), which grows along the A3+ spine (green).
Current usage metrics show cumulative count of Article Views (full-text article views including HTML views, PDF and ePub downloads, according to the available data) and Abstracts Views on Vision4Press platform.
Data correspond to usage on the plateform after 2015. The current usage metrics is available 48-96 hours after online publication and is updated daily on week days.
Initial download of the metrics may take a while.