Fig. C.1.
Download original image
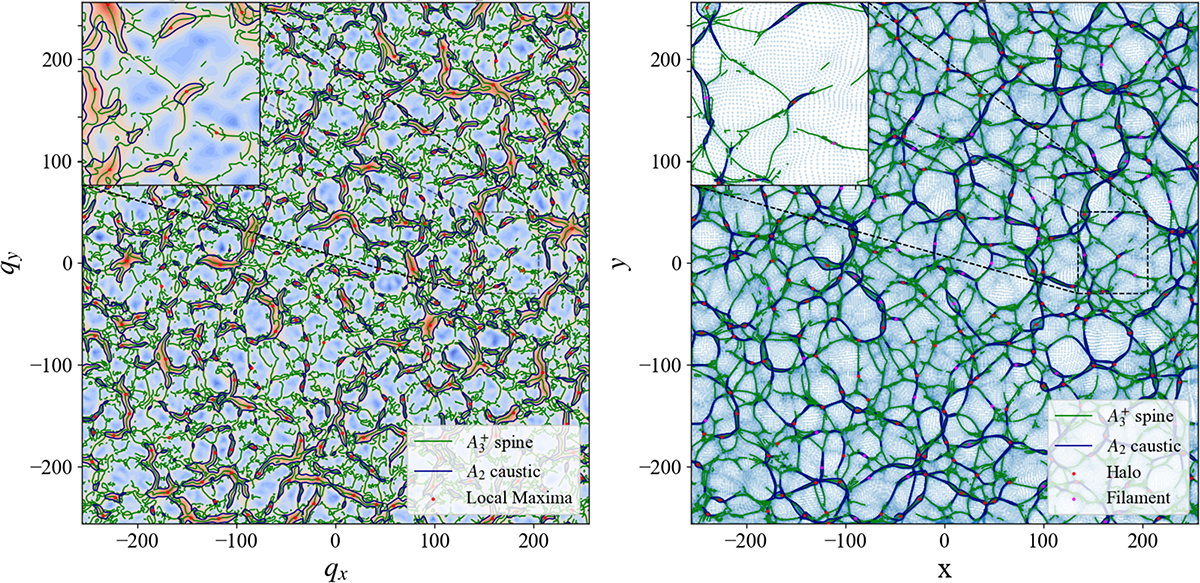
Snapshot from 5122 1-LPT simulation corresponding to power spectrum n = 1, Rc = 10. Left: Color-map of the higher eigenvalue α(q) in Lagrangian space. Right: Particles in Eulerian space. Points of local maxima of the eigenvalue field are highlighted in red. The A3+ spine and A2 caustics are shown as green and blue curves, respectively.
Current usage metrics show cumulative count of Article Views (full-text article views including HTML views, PDF and ePub downloads, according to the available data) and Abstracts Views on Vision4Press platform.
Data correspond to usage on the plateform after 2015. The current usage metrics is available 48-96 hours after online publication and is updated daily on week days.
Initial download of the metrics may take a while.