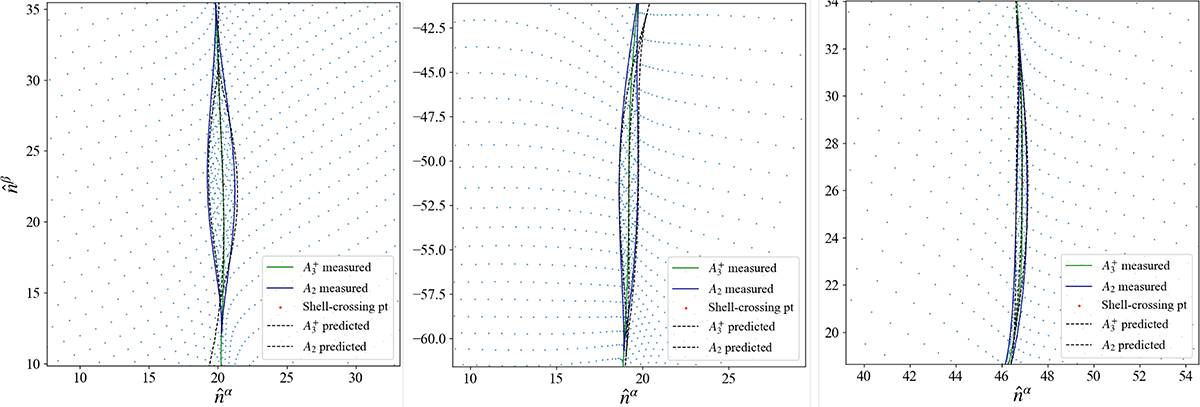
Fig. C.2.
Download original image
Three selected shell-crossing structures in a 1-LPT simulation initialized using Gaussian random field with the power-spectrum parameters n = 1, Rc = 10. The A3+ spine and A2 caustic measured from the simulation are shown in solid lines. For comparison, the A3+ spine and A2 caustic predicted from our analytical model are shown in dashed lines.
Current usage metrics show cumulative count of Article Views (full-text article views including HTML views, PDF and ePub downloads, according to the available data) and Abstracts Views on Vision4Press platform.
Data correspond to usage on the plateform after 2015. The current usage metrics is available 48-96 hours after online publication and is updated daily on week days.
Initial download of the metrics may take a while.