Fig. 12.
Download original image
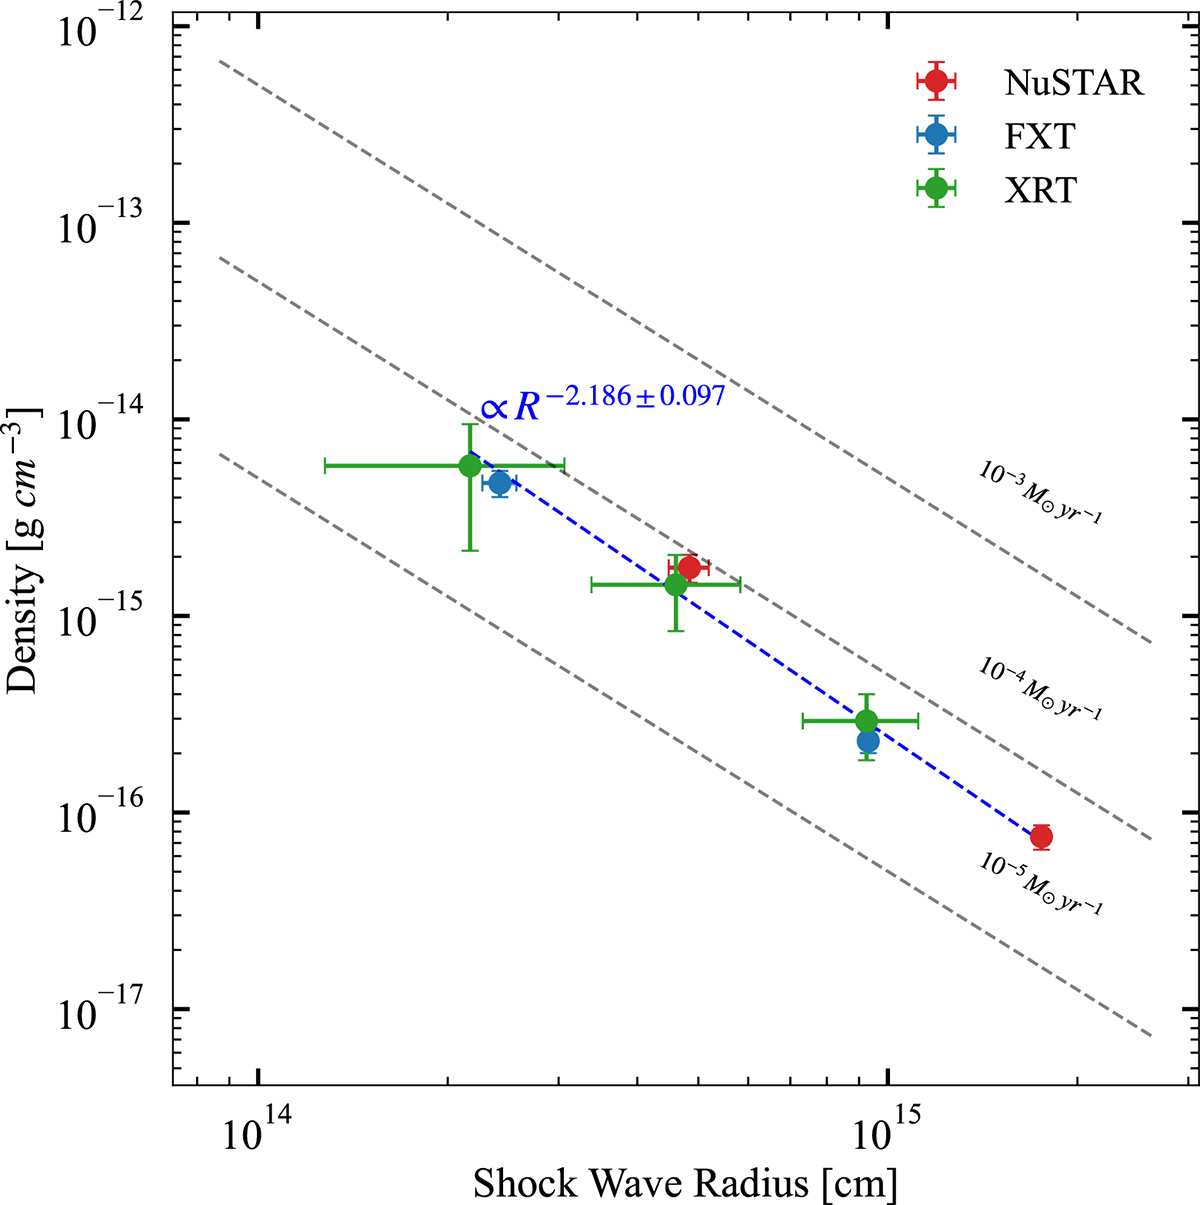
Circumstellar material density profile as inferred from the EM. Data from NuSTAR, Swift-XRT, and EP-FXT are indicated by the red, green, and blue circles, respectively. The dashed gray lines represent the wind-like density profiles corresponding to mass-loss rates of Ṁ = 10−5, 10−4, 10−3 M⊙ yr−1. The dashed blue line denotes the power-law fit to the X-ray light curve. The inferred radial density profile ρCSM ∝ R−2.19 ± 0.10 is compatible with a homogeneous mass-loss wind within ∼2σ.
Current usage metrics show cumulative count of Article Views (full-text article views including HTML views, PDF and ePub downloads, according to the available data) and Abstracts Views on Vision4Press platform.
Data correspond to usage on the plateform after 2015. The current usage metrics is available 48-96 hours after online publication and is updated daily on week days.
Initial download of the metrics may take a while.