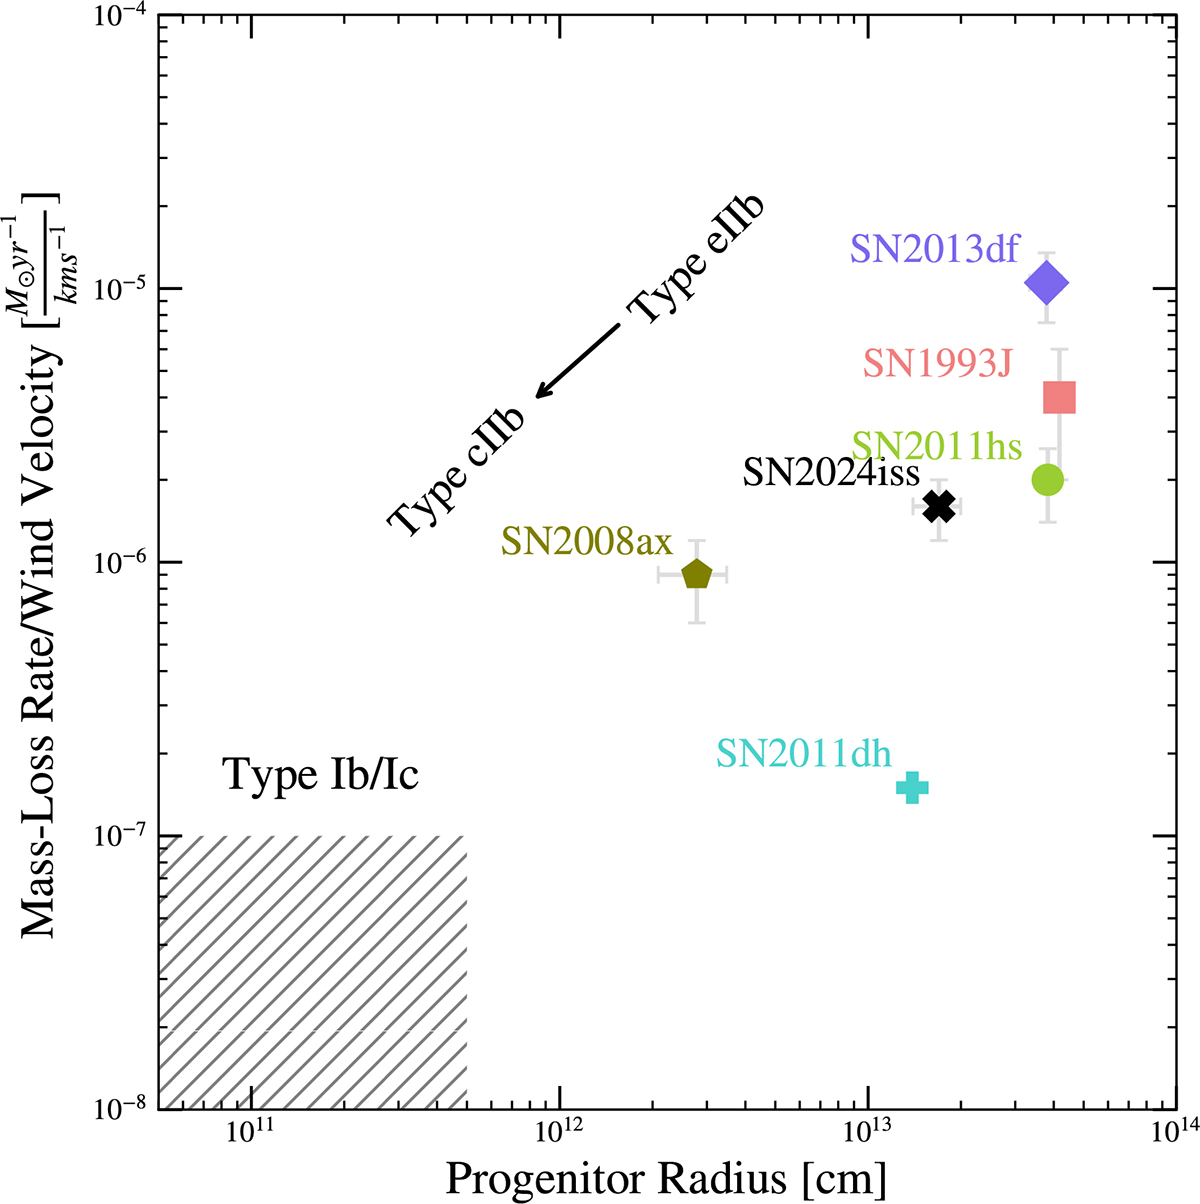
Fig. 14.
Download original image
Comparison between the mass-loss rate normalized by wind velocity (Ṁ/vw) and the progenitor radius. The shaded region indicates typical CSM densities of Type Ib/c SNe (Chevalier & Fransson 2006), though these estimates may suffer from systematic uncertainties of up to an order of magnitude (Maeda et al. 2012). Color coded symbols represent the estimated values for different SNe as labeled. The upper-right to lower-left arrow illustrates a possible evolutionary sequence from Type eIIb to cIIb and eventually to Type Ib/Ic SNe.
Current usage metrics show cumulative count of Article Views (full-text article views including HTML views, PDF and ePub downloads, according to the available data) and Abstracts Views on Vision4Press platform.
Data correspond to usage on the plateform after 2015. The current usage metrics is available 48-96 hours after online publication and is updated daily on week days.
Initial download of the metrics may take a while.