Fig. 9.
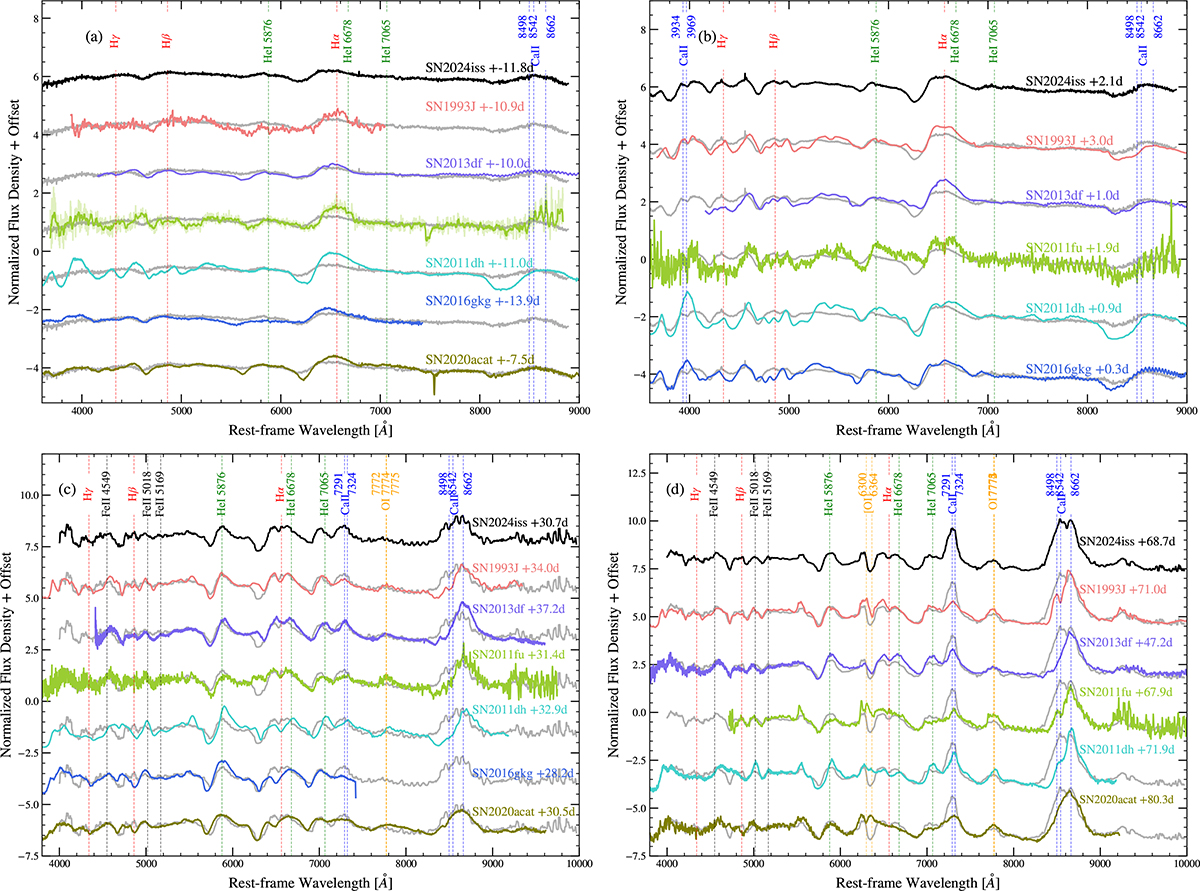
Download original image
Spectra of SN 2024iss at (a) −12, (b) 2, (c) 31, and (d) 69 days relative to V-band peak brightness compared with other well-studied SNe IIb at similar phases. Phases with respect to the V maximum are labeled. All spectra are shown in the rest frame and have been normalized. The vertical dashed lines mark the positions of certain spectral features at zero rest-frame velocity. For comparison, the gray curve underlying the spectrum of each comparison SN shows the shifted spectrum of SN 2024iss that matches their mean flux within the displayed wavelength range.
Current usage metrics show cumulative count of Article Views (full-text article views including HTML views, PDF and ePub downloads, according to the available data) and Abstracts Views on Vision4Press platform.
Data correspond to usage on the plateform after 2015. The current usage metrics is available 48-96 hours after online publication and is updated daily on week days.
Initial download of the metrics may take a while.