Fig. 5
Download original image
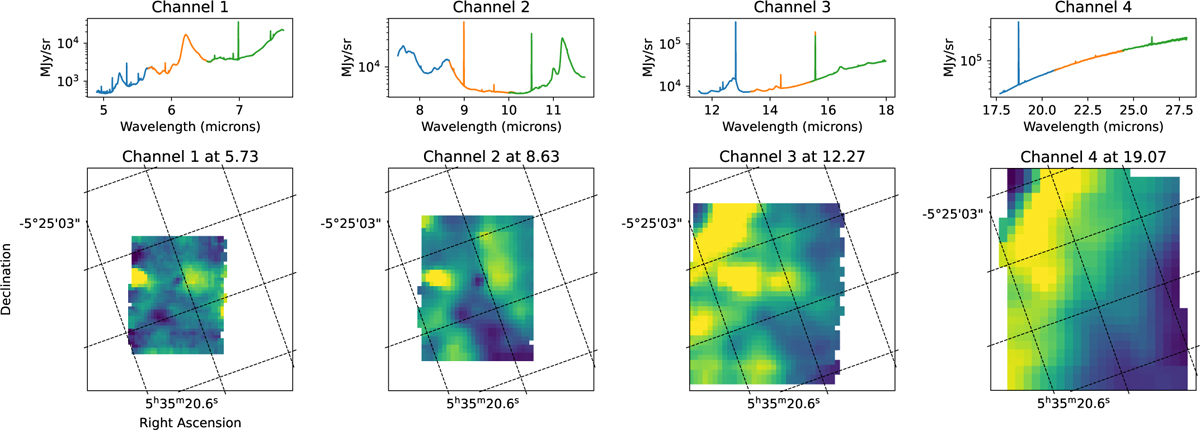
First row: average spectra over the entire field of view of each channel (shown in the second row). A different color (blue, orange, green) is used for each sub-channel (short, medium, long). Second row: MIRI-MRS images at different wavelengths (the images are aligned). It can be observed that the field of view increases with the channel but the spatial resolution deteriorates.
Current usage metrics show cumulative count of Article Views (full-text article views including HTML views, PDF and ePub downloads, according to the available data) and Abstracts Views on Vision4Press platform.
Data correspond to usage on the plateform after 2015. The current usage metrics is available 48-96 hours after online publication and is updated daily on week days.
Initial download of the metrics may take a while.