Open Access
Fig. 7.
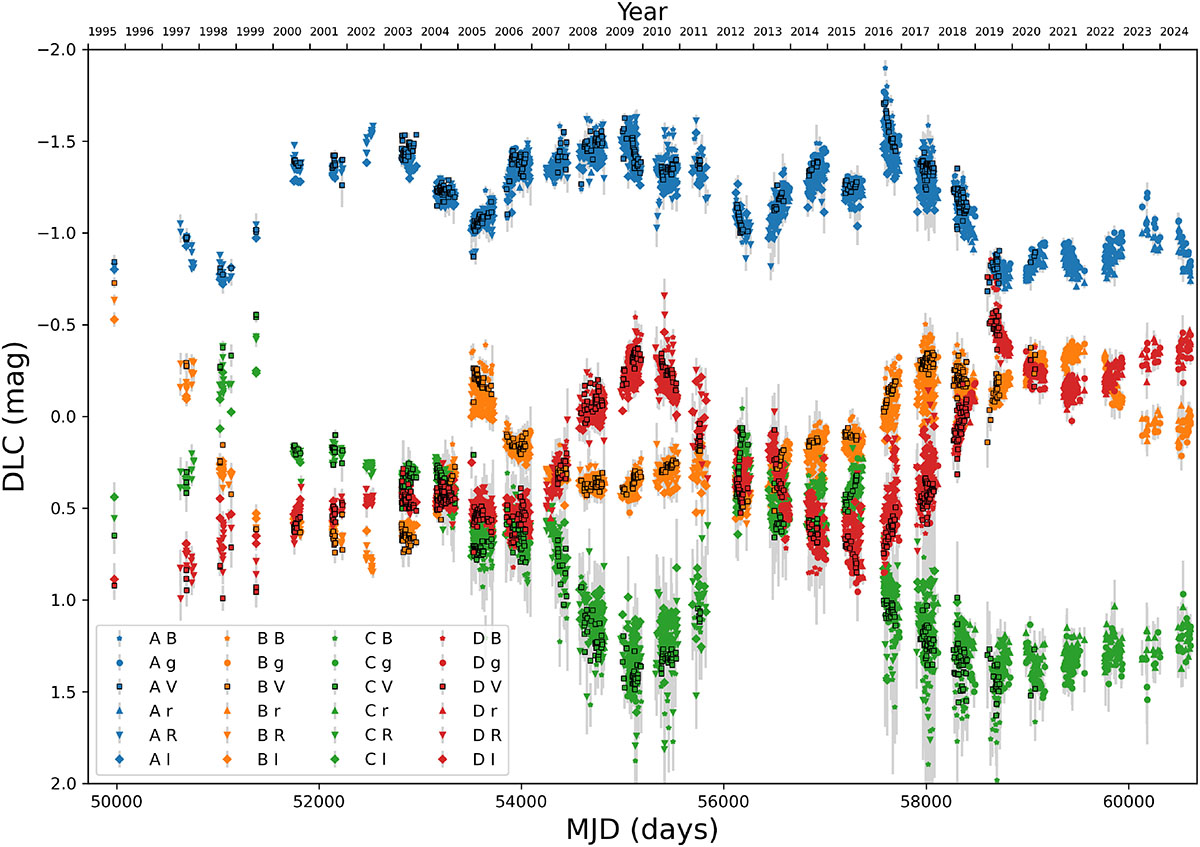
Download original image
Difference light curves in the BgVrRI bands. Squares with black borders indicate the microlensing signals in the V band. Details of the DLCs in five well-sampled observing seasons are shown in Appendix B.
Current usage metrics show cumulative count of Article Views (full-text article views including HTML views, PDF and ePub downloads, according to the available data) and Abstracts Views on Vision4Press platform.
Data correspond to usage on the plateform after 2015. The current usage metrics is available 48-96 hours after online publication and is updated daily on week days.
Initial download of the metrics may take a while.