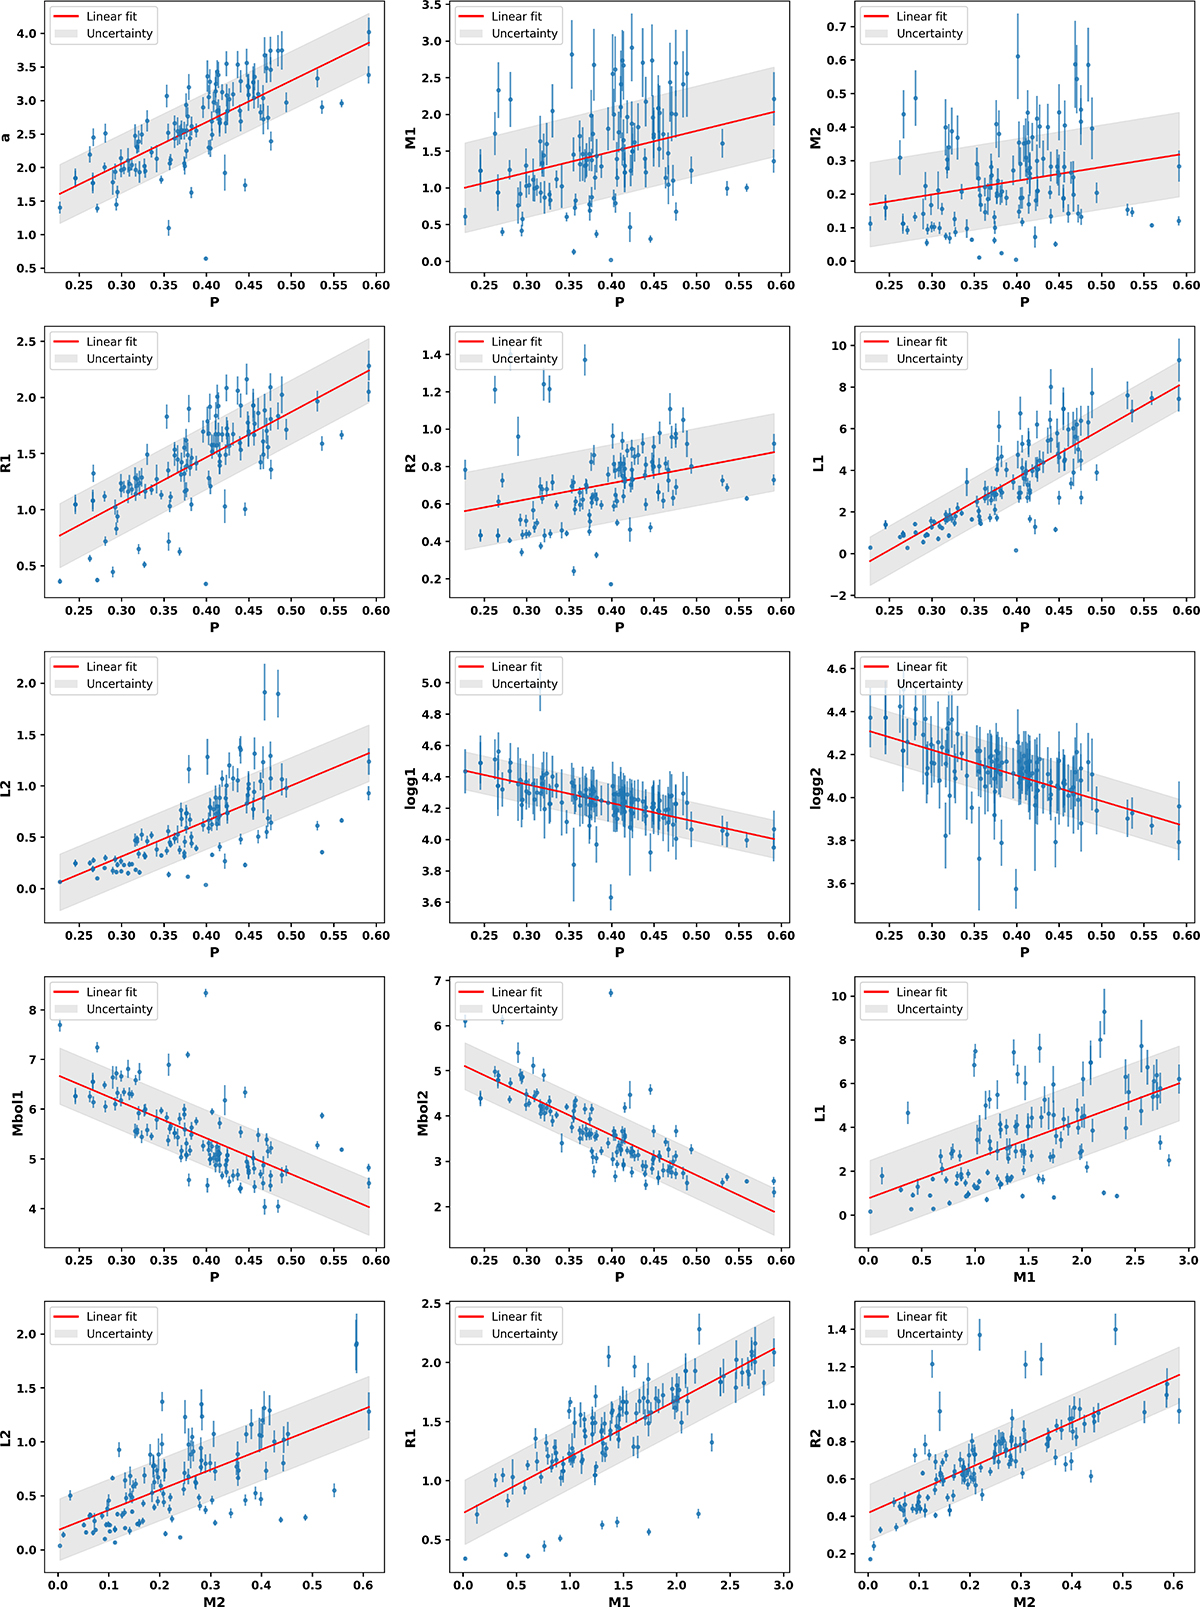
Fig. 6.
Download original image
Scatter plots illustrating correlations between selected stellar parameters in low mass-ratio contact binaries with orbital periods shorter than 0.6 days. The linear regression lines are overlaid. The red lines correspond to fits using mean errors, and the blue lines correspond to fits using errors reported in the literature. The shaded areas indicate the ±1σ uncertainty ranges for each fit.
Current usage metrics show cumulative count of Article Views (full-text article views including HTML views, PDF and ePub downloads, according to the available data) and Abstracts Views on Vision4Press platform.
Data correspond to usage on the plateform after 2015. The current usage metrics is available 48-96 hours after online publication and is updated daily on week days.
Initial download of the metrics may take a while.