| Issue |
A&A
Volume 710, June 2026
|
|
|---|---|---|
| Article Number | A49 | |
| Number of page(s) | 9 | |
| Section | Stellar structure and evolution | |
| DOI | https://doi.org/10.1051/0004-6361/202558462 | |
| Published online | 28 May 2026 | |
Multivariate statistical analysis of contact binaries with a low mass ratio: Definition, dynamical stability, and parameter relations
1
LUX, Observatoire de Paris, CNRS, PSL, 61 Avenue de l’Observatoire, 75014 Paris, France
2
Department of Physics, University of Pisa, 56127 Pisa, Italy
3
Independent Astrophysics Researcher, Tehran 15875, Iran
4
Department of Theoretical Physics and Astrophysics, University of Zanjan, Zanjan, Iran
5
Çanakkale Onsekiz Mart University, Faculty of Science, Department of Physics, 17020 Çanakkale, Türkiye
6
Çanakkale Onsekiz Mart University, Astrophysics Research Center and Ulupnar Observatory, 17020 Çanakkale, Türkiye
★ Corresponding authors: This email address is being protected from spambots. You need JavaScript enabled to view it.
; This email address is being protected from spambots. You need JavaScript enabled to view it.
Received:
8
December
2025
Accepted:
3
April
2026
Abstract
This study explores multiple aspects of W Ursae Majoris (W UMa) contact binary systems with low mass ratios. We provide empirical insights into their definition, structure, rotational stability, and parameter relations. We first examined the range of mass ratios that characterize these systems, and based on an analysis of 818 contact binaries, we established an empirical threshold of q ≈ 0.27 to identify systems with a low mass ratio. To investigate the rotational stability, we conducted a Monte Carlo analysis of the squared gyration radii (k12 and k22) and assessed the resulting spin-to-orbital angular momentum ratio (Jspin/Jorb). While k1 remains nearly constant, k2 and Jspin/Jorb decrease slightly with increasing mass ratio. This emphasizes the role of the secondary star’s internal structure. Moreover, we compiled a dedicated sample of 115 contact binaries with a low mass ratio and estimated their absolute parameters using Gaia DR3 parallaxes. From this dataset, we derived empirical parameter relations for systems with a low mass ratio that provide a useful reference for future observational and theoretical studies. The resulting datasets and statistical summaries offer benchmarks for modeling, stability evaluation, and evolutionary studies of W UMa-type binaries with low mass ratios.
Key words: methods: data analysis / binaries: eclipsing / stars: fundamental parameters
© The Authors 2026
 Open Access article, published by EDP Sciences, under the terms of the Creative Commons Attribution License (https://creativecommons.org/licenses/by/4.0), which permits unrestricted use, distribution, and reproduction in any medium, provided the original work is properly cited.
This article is published in open access under the Subscribe to Open model. This email address is being protected from spambots. You need JavaScript enabled to view it. to support open access publication.
1. Introduction
Contact binaries are close binary systems with short orbital periods in which both stars fill their Roche lobes and share a common convective envelope (Eggleton 2006). The energy generated by the components is transported throughout this envelope, producing an almost uniform surface temperature that does not strongly depend on the stellar masses (Lucy 1968; Shu & Lubow 1981; Eggleton 2006). At sufficiently high orbital inclinations, these systems are classified as W UMa-type eclipsing binaries. They are more likely to develop starspots than other types of close binaries due to mass and energy transfer and associated magnetic activity (O’Connell 1951; Zhou & Leung 1990).
An important parameter of contact binaries is the mass ratio, q = M2/M1 (q ≤ 1). After formation, contact binaries evolve toward lower values of the mass ratio in a nonlinear way (Pešta & Pejcha 2023). They may undergo thermal relaxation oscillations (TROs), during which mass transfer can briefly reverse, and contact is broken (Lucy 1976; Robertson & Eggleton 1977; Yakut & Eggleton 2005). The TRO cycle depends on the secondary’s thermal timescale, which grows as the mass ratio decreases, causing systems to accumulate at a low mass ratio (Rucinski 2001). Alternative models suggest rapid initial mass transfer followed by mass-ratio inversion and roughly linear evolution toward a low mass ratio (Stępień 2011). The mass inequality grows until tidal Darwin instability occurs, when the primary’s spin exceeds one-third of the orbital angular momentum (Hut 1980). Previous studies have suggested that contact binaries with extremely low mass ratios may reach tidal instability, as described by Darwin, which can lead to rapid merger events (Li & Zhang 2006; Jiang et al. 2010; Poro et al. 2026). However, the precise value of this lower mass-ratio limit remains a subject of debate. Theoretical predictions have placed this cutoff within a broad range, typically between q ∼ 0.04 and q ∼ 0.10, depending on assumptions for the stellar structure, angular momentum distribution, and evolutionary stage (Arbutina 2007, 2009; Yang & Qian 2015; Arbutina & Wadhwa 2024).
Observationally, several overcontact binaries with q < 0.1 have been reported (e.g., Yang & Qian 2015; Li et al. 2024), challenging the strict theoretical limits and suggesting that at least some very low mass-ratio systems may persist in a quasi-stable state. These findings indicate that the minimum mass ratio may not represent an absolute cutoff, but rather a transitional range affected by system-specific conditions such as total mass, fillout factor, and angular momentum loss.
Despite extensive theoretical and observational efforts, the fundamental processes governing the formation, evolution, and stability of contact binaries with low mass-ratios remain poorly understood. Current models disagree on whether systems with extremely low mass-ratios can maintain long-term dynamical stability or inevitably evolve toward a merger, and observational constraints are further limited by selection effects, small sample sizes, and systematic uncertainties in determining the mass ratio (Li & Zhang 2006; Arbutina 2007). Moreover, the empirical boundary separating stable low mass-ratio systems from those approaching tidal instability has not yet been reliably established, partly due to the absence of uniform analyses across large, homogeneous datasets (Rucinski 2001). Defining this boundary is essential for understanding the ultimate fate of contact binaries, their connection to binary-merger pathways, and their contribution to the formation of blue stragglers and FK Com-type stars (Webbink 1976). These gaps highlight the need for a comprehensive statistical investigation based on updated observational samples and consistent modeling. The structure of the paper is as follows: Section 2 presents the results of our empirical study on defining low mass ratios in contact binary systems. Section 3 presents the evaluation of squared gyration radii and their impact on spin-orbit stability in low mass-ratio contact binaries. Section 4 examines the empirical parameter relations for contact binaries with low mass ratios, and Section 5 provides the discussion and conclusions.
2. Definition of the low mass-ratio range
Numerous studies have investigated the properties of W UMa-type contact binaries, focusing on how their structural and dynamical characteristics vary with system parameters (e.g., Rucinski 2001; Qian 2001; Zhang & Qian 2020; Poro et al. 2022; Pešta & Pejcha 2023). Many studies considered systems with q ≲ 0.25 as belonging to the range of low mass ratios, although this range has not been established through systematic statistical or empirical analysis. In the literature, the definition of a low mass ratio in contact binaries varies among studies. Accordingly, one of the objectives of this study is to more precisely constrain the range of low mass ratios in contact binary systems using statistical and empirical analyses.
We analyzed a sample of 818 contact binary systems compiled by Poro et al. (2025) in order to determine the parameter range of systems with a low mass ratio. The analysis focused on a set of independent parameters derived from light-curve modeling and observational data: the orbital period (P), mass ratio (q), fillout factor (f), and component temperatures (T1, 2). Parameters such as the luminosity ratio (l1/l2) and the fractional radii ratio (r1/r2), which depend directly on q, were not treated as independent variables and were therefore excluded from this study. Based on assumptions from previous studies, a threshold mass ratio of q = 0.25 was adopted to separate systems with a low mass ratio from systems with a higher mass ratio. This criterion was then used to compare the distributions of independent parameters between systems with q < 0.25 and those with q ≥ 0.25. Our analysis is based on a statistical comparison of the independent parameters between systems with q < 0.25 and q ≥ 0.25. It includes the use of the Mann-Whitney U test to assess the significance of the differences and a decision tree to evaluate feature importance and shows that the fillout factor exhibits the largest difference across this threshold. Systems with q < 0.25 typically exhibit a broad distribution of fillout factors, with their average degree of contact tending to be higher. Conversely, systems with q ≥ 0.25 predominantly show lower degrees of contact. This trend may reflect the underlying binary interaction processes. Systems with a low mass ratio are more likely to evolve into deeper contact configurations through the combined effects of the Roche geometry, mass transfer, and angular momentum loss. Energy and mass redistribution within the overcontact region also contribute to a higher fillout factor in these systems. The orbital period exhibits the next largest variation, with systems with a low mass ratio generally having shorter periods, as expected for systems in which the components are more closely packed to maintain gravitational equilibrium under high overcontact conditions. Other parameters, such as component temperatures, show smaller systematic differences across the threshold. In summary, the feature-importance analysis indicates that the fillout factor contributes most to the distinction of systems with a low and high mass ratio with an importance of 39.6%, followed by the orbital period with 18.7%, the secondary temperature with 15.9%, and the primary temperature with 14.4% (Figure 1). These results are based on the application of min-max scaling, a common method for normalizing mean values (Figure 1). This normalization enables comparison of parameters within a similar range. Additionally, we examined the standard robustscaler and absolute robustscaler methods. Ultimately, the final results indicated no significant differences among the scaling techniques.
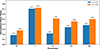 |
Fig. 1. Comparison of normalized mean values of key parameters between contact binary systems with low mass ratios (q < 0.25, orange) and higher mass ratios (q ≥ 0.25, blue). Each parameter is scaled to [0, 1] for a direct comparison. |
Then, we examined the pairwise correlations of the orbital period, mass ratio, and fillout factor. The correlation analysis, expressed in terms of the Pearson correlation coefficient r, shows that the orbital period is weakly anticorrelated with the mass ratio (r = −0.27) and weakly positively correlated with the fillout factor (r = 0.28), while the mass ratio and the fillout factor exhibit a moderate negative correlation (r = −0.50). These results indicate that no two parameters alone display a strong linear dependence. Nevertheless, when all three parameters are considered together, systems with a low mass ratio can be identified more clearly than using any two parameters alone. Figure 2 shows the pairwise scatter plots of P, q, and f, with a kernel density estimation (KDE) applied on the diagonals to visualize the distributions. The mass-ratio distribution appears to be double-peaked in Figure 2, with a clear maximum around q ∼ 0.4, while the second peak is less pronounced.
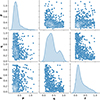 |
Fig. 2. Pairwise scatter plots of the orbital period, mass ratio, and fillout factor for the contact binary sample, with KDE on the diagonals. |
To investigate the three-way interdependence of these parameters and define a statistical range for low mass-ratio contact systems, we applied a three-dimensional KDE approach. KDE provides a smooth, continuous estimate of the probability density function in the joint parameter space defined by log P, f, and q. For each point in this space, the density is estimated as the weighted contribution of all surrounding systems, where the weighting is controlled by a kernel function (typically Gaussian) and a bandwidth parameter that sets the effective smoothing scale. By evaluating this density field, it is possible to identify regions of high statistical concentration corresponding to physically common system configurations, as well as sharp declines in density that suggest natural empirical boundaries.
In our analysis, we projected the KDE-derived density distribution onto the q-axis while preserving the effect of log P and f. This projection reveals the change in the overall density of contact binaries as a function of mass ratio, conditioned by the other two parameters. The distribution clearly drops around q ≈ 0.27, below which the density of systems declines significantly. This transition is not imposed by an arbitrary cutoff, but emerges naturally from the underlying density field. Systems with q ≲ 0.27 were therefore identified as low mass-ratio candidates, with this threshold representing the point at which the KDE-estimated density falls below a statistically significant level relative to the surrounding distribution. This threshold corresponds to a statistically significant level, which refers to a density drop that is lower by more than two to three standard deviations than the surrounding data, indicating that the observed difference is unlikely to be due to random effects.
Figure 3 presents the results using two complementary visualizations, highlighting the distribution of systems in the (P, f, q) parameter space and the corresponding mass-ratio distribution. These visualizations clearly identify the systems with a low mass ratio and simultaneously convey the distributions and interrelations of all three parameters in the sample.
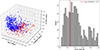 |
Fig. 3. Left: 3D scatter plot of log P, f, and q for the contact binary sample. Systems with q ≲ 0.27 are highlighted in red. Right: Histogram of q. The vertical red line marks the low mass-ratio threshold. |
This KDE-based approach thus provides a clear and reproducible way to explore the multidimensional parameter space of contact binaries. By simultaneously incorporating orbital period, fillout factor, and mass ratio, it defines an empirical upper limit for systems with a low mass ratio.
In the literature, contact binaries with extremely low mass ratios have attracted significant attention. However, their theoretical and observational cutoff in mass ratio remains highly challenging and is not well established so far. Contact binary systems with extremely low mass ratios are studied from the perspective of theoretical dynamical stability (Rasio 1995; Li & Zhang 2006; Arbutina 2007, 2009; Jiang et al. 2010; Yang & Qian 2015; Wadhwa et al. 2021; Arbutina & Wadhwa 2024; Wadhwa et al. 2024). Predicted minimum mass ratios have been refined over time, from early estimates of qmin ∼ 0.09 (Rasio 1995) to more recent values as low as 0.038–0.041, depending on primary mass, stellar structural parameters, and metallicity (Wadhwa et al. 2021; Zhang 2024; Arbutina & Wadhwa 2024; Wadhwa et al. 2024). Observationally, confirmed examples remain rare. They include V1309 Sco (Tylenda et al. 2011), VSX J082700.8+462850 (Li et al. 2021), TYC 4002-2628-1 (Guo et al. 2022), TYC 3801-1529-1 (Li et al. 2024), and ASASSN-V J175200.35+361805.2 (Guo et al. 2025), whose mass ratios reach as low as 0.027. These systems provide crucial observational benchmarks for studying the dynamics, stability, and merger potential of contact binaries with extremely low mass ratios (Poro et al. 2026).
3. Gyration and spin-orbit dynamics
Contact binary stars are dynamically complex systems whose long-term evolution is governed by the interplay between stellar spin and orbital motion. It is essential to understand the balance between spin and orbital angular momentum to assess their rotational stability, particularly in the context of Darwin’s instability criterion. In many studies, the dimensionless stellar structure constant k1, 2 (Li & Zhang 2006), also referred to as the squared gyration radius, has commonly been adopted as k1, 2 = 0.06 for all contact binaries, but this approximation is strictly valid only when both components are main-sequence stars. For contact binaries with low mass ratios, this assumption may break down because the stellar components can differ significantly in their internal structure, leading to inaccurate stability assessments. Because the structural properties of the stellar components and their observational uncertainties strongly affect this balance, a statistical approach is required to properly account for parameter variations. This motivates a Monte Carlo (MC) analysis that simultaneously incorporates theoretical priors on internal structure and observational uncertainties, enabling a robust evaluation of the stability of contact binaries.
We performed an MC analysis to estimate the spin parameters and rotational stability of a sample of 501 contact binary stars collected from the Poro et al. (2025) study, where the required parameters are available for all systems. The dataset included the primary and secondary masses, radii, semimajor axis, fillout factor, and squared gyration radii (k12, k22). Priors for k12 and k22 were adopted based on models of the theoretical stellar structure that provide typical values of the squared gyration radius for stars with different internal configurations. For the primary components, which are generally more massive and main-sequence stars, we adopted k12 = 0.06(1), which is close to the classical values derived from polytropic models (n = 3) and solar-type stellar structure calculations (Claret & Gimenez 1993; Claret 2004). For secondary components, the priors were adjusted according to their mass (or effective temperature) to reflect the stronger degree of central concentration or convection: low-mass stars (M2 < 0.25, M⊙ or Teff < 3800 K) were assigned k22 = 0.18(3) (fully convective configuration, consistent with n = 1.5 polytropes), intermediate-mass stars (0.25 < M2 < 0.6, M⊙) were given k22 = 0.10(2), and higher-mass secondaries were set to k22 = 0.06(1). These values are consistent with stellar evolution calculations and widely adopted approximations in the literature (Claret & Gimenez 1993; Claret 2004).
For each of NMC = 1000 MC realizations, the squared gyration radii k12 and k22 were sampled from these priors and restricted to the physically reasonable interval 0.001 ≤ k2 ≤ 0.4, while the observed stellar parameters, mass M1, 2, radius R1, 2, and semimajor axis a were taken directly from the dataset without perturbation. Spin and orbital angular momenta were then calculated as
 (1)
(1)
 (2)
(2)
 (3)
(3)
and their ratio Jspin/Jorb was evaluated.
To properly account for the consistency of the MC realizations with theoretical expectations, a log-likelihood function was computed for each realization,
![Mathematical equation: $$ \begin{aligned} \log \mathcal{L} = -\frac{1}{2} \left[ \frac{\left(k_1^2 - k_{1,\mathrm{th} }^2\right)^2}{\sigma _{k_1^2}^2} + \frac{\left(k_2^2 - k_{2,\mathrm{th} }^2\right)^2}{\sigma _{k_2^2}^2} \right] - \ln \left(\sigma _{k_1^2} \sigma _{k_2^2} 2\pi \right), \end{aligned} $$](/articles/aa/full_html/2026/06/aa58462-25/aa58462-25-eq4.gif) (4)
(4)
where k1, th2 and k2, th2 are the theoretical squared gyration radii for the primary and secondary stars, respectively, and σk12, σk22 are the prior uncertainties. This log-likelihood quantifies the agreement between each MC sample and the theoretical priors, allowing us to identify the most probable realizations while naturally incorporating variations in stellar structure.
The mean and median absolute deviation (MAD) of k1, k2, and Jspin/Jorb were then derived over all realizations. Figure 4 presents a composite illustration of the results. Panel (a) shows the histogram of Jspin/Jorb with a vertical line indicating the classical Darwin limit. Panel (b) presents the two-dimensional scatter plot of mass ratio versus Jspin/Jorb with uncertainty bands represented by the MAD of MC realizations. These plots highlight the regions of stable and unstable systems across the sample.
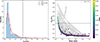 |
Fig. 4. (a) Histogram of Jspin/Jorb with a KDE overlay. The vertical line indicates the classical Darwin limit (0.333). (b) Two-dimensional scatter plot of the mass ratio vs. Jspin/Jorb, with uncertainty bands represented by the MAD of the MC realizations. |
Statistical summaries were computed by binning systems according to their mass ratio. Table 1 presents the median and MAD of k1, k2, and Jspin/Jorb within each q bin. k1 clearly remains nearly constant, while k2 and Jspin/Jorb decrease slightly with increasing mass ratio. This reflects the effect of the secondary structure on the rotational stability (Figure 5).
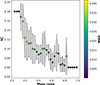 |
Fig. 5. Median values of k22 vs. mass ratio, computed over the mass-ratio intervals listed in Table 1. The shaded regions denote the MAD, and colors encode the corresponding MAD. |
Statistical summary of k12, k22, and Jspin/Jorb for contact binaries.
4. Empirical parameter relations
4.1. New dataset for low mass ratio contact systems
We compiled a dataset from the literature of contact binary systems with low mass ratios, defined as q < 0.27 according to the threshold established in Section 2. For each system, we gathered the parameters reported in the literature, including orbital period (P), orbital inclination (i), fillout factor (f), T1, 2, r1, 2 and l1, 2, and reports of the presence of starspots or third-body companions. Absolute parameters published in previous studies were also included when available. Subsequently, we recalculated the absolute parameters for all systems using Gaia DR3 parallaxes. To ensure consistency and reliability of the sample, several exclusion criteria were applied. Systems without Gaia DR3 parallaxes, with interstellar extinction (AV) > 0.4 (Poro et al. 2024), or lacking essential input parameters for the calculations (component effective temperatures, q, r1, 2, and l1, 2 from published sources; maximum brightness (Vmax) from the VSX or AAVSO database; and orbital period P from ASAS-SN) were excluded. The sample we studied comprises contact binary systems with orbital periods shorter than 0.6 days, in accordance with the criteria adopted by Poro et al. (2022). In addition, systems showing discrepancies larger than 0.1 between semimajor axes, which may indicate unreliable solutions, were excluded following the criterion of Poro et al. (2024). After we applied these filtering steps, the final dataset consisted of 115 low mass-ratio contact binaries. This sample is made available in a machine-readable format in the online version of the paper.
The absolute visual magnitude (MV) of each system was calculated from the Vmax, the distance from Gaia DR3 parallaxes (d), and AV (Equation (5)). The magnitudes of the individual components (MV1 and MV2) were obtained using the luminosity ratios (l1, 2/ltot) (Equation (6)),
 (5)
(5)
 (6)
(6)
Bolometric magnitudes (Mbol1,2) were computed by applying bolometric corrections (BC1, 2), and stellar luminosities (L1, 2) were then derived from these bolometric magnitudes. Stellar radii (R1 and R2) were determined from the L1, 2 and effective temperatures (T1, 2).
The semimajor axis of each system was estimated from the stellar radii (R1, 2) and r1, 2; two values, a1 and a2, were calculated independently, and the mean was adopted when the difference between them (Δa) was smaller than 0.1. Using the semimajor axis together with the orbital period and mass ratio, we calculated the stellar masses according to Kepler’s third law,
 (7)
(7)
Surface gravities (log g1 and log g2) were then derived from the M1, 2 and R1, 2). The orbital angular momentum of each system was computed as
 (8)
(8)
where Mtot is the total mass of the system.
4.2. Relations
Although numerous theoretical and observational studies have been devoted to contact binary stars, our understanding of their physical behaviors remains incomplete. Nevertheless, continuous revisions of empirical analyses concerning the parameter relations of these systems can be highly beneficial. The available results on such relations reveal both strong and weak trends, depending on the selected sample and the method employed. Therefore, sustained efforts to revisit these relations using larger and more comprehensive samples are of considerable importance, particularly since these relations can serve as valuable tools for estimating the absolute parameters of these systems. Such empirical revisions of parameter relations are usually carried out for the entire class of contact binary systems, sometimes with additional constraints. For instance, Latković et al. (2021) applied an orbital period limit of 0.5 days in his updates of empirical parameters, motivated by the break in the period–temperature diagram. Similarly, other studies, such as Poro et al. (2022), adopted a period limit of 0.6 days. In some cases, these revisions were also restricted to the A- and W-subtypes of contact binaries. However, no empirical relations or dedicated samples have yet been provided for the subclass of contact binaries with low mass ratios. As presented in Section 2, this type of contact binary can exhibit certain common relative properties. Considering that in these systems, the mass and radius ratios differ from those of other contact binaries, we attempted to independently examine and provide empirical relations for their parameters.
Using the constructed sample of low mass-ratio contact binaries, for which absolute parameters were estimated from Gaia DR3 parallaxes, we provide independent empirical relations for the parameters of these systems. The empirical relations for low mass-ratio contact binaries we considered include the following: P − M1, 2, P − R1, 2, P − L1, 2, P − Mbol 1, 2, P − log g1, 2, P − a, M1, 2 − L1, 2, and M1, 2 − R1, 2. All of these relations were derived and are presented in Table 2.
Extracted empirical relations of the parameters with their uncertainties.
Linear regressions were performed to investigate the correlations among the derived absolute parameters of contact binaries with a single approach based on a representative average uncertainty of the derived parameters. Fits were obtained via standard least-squares minimization, assuming the same characteristic uncertainty for all data points. The results are presented in Figure 6, where the regression solutions are shown with their ±1σ confidence ranges. These two-dimensional relations are presented using empirical parameters in solar units. Furthermore, as illustrated in Figure 6, they can satisfactorily be described by linear fits.
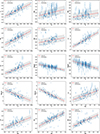 |
Fig. 6. Scatter plots illustrating correlations between selected stellar parameters in low mass-ratio contact binaries with orbital periods shorter than 0.6 days. The linear regression lines are overlaid. The red lines correspond to fits using mean errors, and the blue lines correspond to fits using errors reported in the literature. The shaded areas indicate the ±1σ uncertainty ranges for each fit. |
5. Discussion and conclusion
We addressed several aspects of a specific group of contact binaries, which in the literature are commonly referred to as systems with a low mass ratio. The first objective was to establish an empirical upper boundary for the mass ratio in this group, and the possible cutoff was also discussed. In addition, results from an MC analysis of spin-orbit stability were presented. They provided insights that might contribute to future investigations. By compiling and estimating the absolute parameters, we constructed a dedicated sample of low mass-ratio contact binary systems, which enabled us to examine and propose empirical relations among their physical parameters. The discussion and conclusions regarding the findings are presented below.
(A) Previous studies of W UMa-type contact binaries did not identify a clear boundary for systems with a low mass ratio, and as a result, the range of physical parameters defining such systems remained uncertain. We analyzed a large sample of contact binaries, described in Section 2, and identified an empirical upper boundary for systems with a low mass ratio based on their physical properties. By examining independent parameters such as the orbital period, the fillout factor, the inclination, and the component temperatures, we identified the range of mass ratios corresponding to systems of low mass ratio, and we investigated which physical characteristics most clearly distinguish them from binaries with a higher mass ratio. The correlation analysis showed that while no single physical parameter alone provides a complete separation of low and higher mass-ratio systems, certain parameters, particularly the fillout factor and orbital period, contribute most strongly to the distinction among the populations when considered together. Systems with mass ratios below approximately 0.27 tend to display significantly higher fillout factors, which can be explained by the weaker gravitational effect of the secondary star, which allows the primary envelope to expand farther and form a more developed common envelope. These binaries also generally have shorter orbital periods, which is consistent with the requirement of closer separations under strong overcontact conditions, while component temperatures show only minor differences compared with systems with a higher mass ratio.
(B) Contact binary stars exhibit complex interactions between stellar spin and orbital motion, and stability assessments based on a fixed structural constant may be inaccurate for systems with a low mass ratio because the internal stellar structures are different. To address this, we sampled the squared gyration radii k12 and k22 from theoretical priors while keeping the observed stellar parameters fixed and calculated Jspin/Jorb. The results showed that k1 remains nearly constant, while k2 and Jspin/Jorb decrease slightly with increasing mass ratio, indicating that the internal structure of the secondary affects the rotational stability. The statistical summary provided in Table 1 offers a reference for future studies aiming to model or analyze the rotational properties of low mass-ratio contact binaries.
(C) We compiled a dataset of 115 low mass-ratio (q < 0.27) contact binary systems, collecting orbital and stellar parameters from the literature and calculating absolute values using Gaia DR3 parallaxes. To ensure reliability, we only retained systems with orbital periods shorter than 0.6 days and excluded those lacking essential data, with high extinction (AV > 0.4), or showing discrepancies larger than 0.1 between a1 and a2. Then, using this sample, we derived independent empirical parameter relations for low mass-ratio systems. These relations include orbital period versus mass, radius, luminosity, absolute bolometric magnitude, surface gravity, and semi-major axis, as well as mass–luminosity (M − L) and mass–radius (M − R) relations for each component. These empirical relations can serve as a practical tool for estimating the absolute parameters of low mass-ratio contact binaries when no high-resolution spectroscopy of the two components is available.
It is important to account for the uncertainties in the measured quantities when performing regression analyses. Simple regressions that only consider the nominal values can yield significantly biased results, particularly when a small number of highly precise measurements dominate a larger number of less precise data points. However, the uncertainties in the absolute parameters for the 115 systems in the sample depend on the uncertainties of the light-curve solutions collected from the literature. These light-curve solutions were derived using various methods in different studies, and their levels of precision can vary. Therefore, we used the mean uncertainties of the derived parameters. As shown in Figure 6, some apparently outlying points are also visible. These may arise for different reasons: a system may possess unique characteristics that distinguish it from the rest of the sample, or the result may stem from suboptimal solutions in the literature. In any case, although such points can be treated as outliers in statistical analyses, they should not be disregarded physically.
The estimated absolute parameters allowed us to place the stellar components on the M − L and M − R diagrams (Figures 7a,b). Figures 7a,b show the components in comparison with the zero-age main-sequence (ZAMS) and terminal-age main-sequence (TAMS) boundaries as established by Girardi et al. (2000). As shown in Figures 7a,b, the secondary stars are located above the TAMS, while the more massive primary stars lie near the ZAMS. In some systems, however, the primary stars are also positioned above the TAMS, like their secondary companions, indicating that both stars have evolved. Moreover, Figure 7a shows that a significant number of primary stars are located below the ZAMS. It should be emphasized that contact binaries undergo complex evolutionary processes and interactions (Yakut & Eggleton 2005; Stępień 2011), which cause their evolutionary stages to differ substantially from those of single stars. Therefore, any comparison with the standard single-star ZAMS and TAMS lines should be interpreted with caution. As shown in Figure 8, the distribution of the secondary components emphasizes that caution is required when interpreting their evolutionary status. A significant fraction of the secondaries lie below the Hertzsprung-Russell (H-R) diagram, indicating lower luminosities, while their positions in the M-L and M-R diagrams are affected by Roche lobe filling and energy transfer (Figures 7a,b).
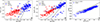 |
Fig. 7. (a) M1, 2 − L1, 2, (b) M1, 2 − R1, 2, (c) Mtot–J0. The diagrams are presented using a logarithmic scale. |
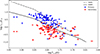 |
Fig. 8. Hertzsprung-Russel diagram showing the positions of the primary and secondary stars in 115 binary systems with a low mass ratio, illustrating their distribution relative to the ZAMS and TAMS lines. |
The orbital angular momentum of each system, estimated using Equation (8), is shown in the log Mtot–J0 diagram for the sample systems (Figure 7c). The area below the quadratic line in Figure 7c is generally associated with contact binary stars, whereas the area above corresponds to detached systems (Eker et al. 2006).
Data availability
Table 3 is available at the CDS via https://cdsarc.cds.unistra.fr/viz-bin/cat/J/A+A/710/A49
Acknowledgments
This work was carried out within the framework of the BSN project (https://bsnp.info). We used data from the European Space Agency mission Gaia (http://www.cosmos.esa.int/gaia). We are grateful to Ehsan Paki and Ghazal Alizadeh for their valuable assistance. We would like to sincerely thank David Valls-Gabaud for his valuable feedback and guidance, which greatly contributed to the improvement of this manuscript. We would like to acknowledge the assistance of Elham Sarvari.
References
- Arbutina, B. 2007, MNRAS, 377, 1635 [NASA ADS] [CrossRef] [Google Scholar]
- Arbutina, B. 2009, MNRAS, 394, 501 [NASA ADS] [CrossRef] [Google Scholar]
- Arbutina, B., & Wadhwa, S. 2024, Serb. Astron. J., 208, 1 [NASA ADS] [CrossRef] [Google Scholar]
- Claret, A. 2004, A&A, 424, 919 [NASA ADS] [CrossRef] [EDP Sciences] [Google Scholar]
- Claret, A., & Gimenez, A. 1993, A&A, 277, 487 [NASA ADS] [Google Scholar]
- Eggleton, P. 2006, Evolutionary Processes in Binary and Multiple Stars (Cambridge, UK: Cambridge University Press) [Google Scholar]
- Eker, Z., Demircan, O., Bilir, S., et al. 2006, MNRAS, 373, 1483 [Google Scholar]
- Girardi, L., Bressan, A., Bertelli, G., et al. 2000, A&AS, 141, 371 [NASA ADS] [CrossRef] [EDP Sciences] [Google Scholar]
- Guo, D.-F., Li, K., Liu, F., et al. 2022, MNRAS, 517, 1928 [NASA ADS] [CrossRef] [Google Scholar]
- Guo, D.-F., Li, K., Liu, F., et al. 2025, AJ, 170, 101 [Google Scholar]
- Hut, P. 1980, A&A, 92, 167 [NASA ADS] [Google Scholar]
- Jiang, D., Han, Z., Wang, J., et al. 2010, MNRAS, 405, 2485 [Google Scholar]
- Latković, O., Čeki, A., & Lazarević, S. 2021, ApJS, 254, 10 [CrossRef] [Google Scholar]
- Li, L., & Zhang, F. 2006, MNRAS, 369, 2001 [CrossRef] [Google Scholar]
- Li, K., Xia, Q.-Q., Kim, C.-H., et al. 2021, ApJ, 922, 122 [NASA ADS] [CrossRef] [Google Scholar]
- Li, K., Gao, X., Guo, D.-F., et al. 2024, A&A, 692, L4 [NASA ADS] [CrossRef] [EDP Sciences] [Google Scholar]
- Lucy, L. B. 1968, ApJ, 151, 1123 [Google Scholar]
- Lucy, L. B. 1976, ApJ, 205, 208 [NASA ADS] [CrossRef] [Google Scholar]
- O’Connell, D. J. K. 1951, Publ. Riverview Coll. Obs., 2, 85 [Google Scholar]
- Pešta, M., & Pejcha, O. 2023, A&A, 672, A176 [NASA ADS] [CrossRef] [EDP Sciences] [Google Scholar]
- Poro, A., Sarabi, S., Zamanpour, S., et al. 2022, MNRAS, 510, 5315 [NASA ADS] [CrossRef] [Google Scholar]
- Poro, A., Hedayatjoo, M., Nastaran, M., et al. 2024, New Astron., 110, 102227 [Google Scholar]
- Poro, A., Jahangiri, E., Sarvari, E., et al. 2025, MNRAS, 538, 1427 [Google Scholar]
- Poro, A., Paki, E., Alicavus, F., & Michel, R. 2026, ApJ, 998, 108 [Google Scholar]
- Qian, S. 2001, MNRAS, 328, 635 [Google Scholar]
- Rasio, F. A. 1995, ApJ, 444, L41 [NASA ADS] [CrossRef] [Google Scholar]
- Robertson, J. A., & Eggleton, P. P. 1977, MNRAS, 179, 359 [NASA ADS] [Google Scholar]
- Rucinski, S. M. 2001, AJ, 122, 1007 [NASA ADS] [CrossRef] [Google Scholar]
- Shu, F. H., & Lubow, S. H. 1981, ARA&A, 19, 277 [Google Scholar]
- Stępień, K. 2011, Acta Astron., 61, 139 [Google Scholar]
- Tylenda, R., Hajduk, M., Kamiński, T., et al. 2011, A&A, 528, A114 [NASA ADS] [CrossRef] [EDP Sciences] [Google Scholar]
- Wadhwa, S. S., De Horta, A., Filipović, M. D., et al. 2021, MNRAS, 501, 229 [Google Scholar]
- Wadhwa, S. S., Landin, N. R., Kostić, P., et al. 2024, MNRAS, 527, 1 [Google Scholar]
- Webbink, R. F. 1976, ApJ, 209, 829 [NASA ADS] [CrossRef] [Google Scholar]
- Yakut, K., & Eggleton, P. P. 2005, ApJ, 629, 1055 [NASA ADS] [CrossRef] [Google Scholar]
- Yang, Y.-G., & Qian, S.-B. 2015, AJ, 150, 69 [NASA ADS] [CrossRef] [Google Scholar]
- Zhang, X.-D. 2024, Sci. Rep., 14, 13011 [NASA ADS] [CrossRef] [Google Scholar]
- Zhang, X.-D., & Qian, S.-B. 2020, MNRAS, 497, 3493 [Google Scholar]
- Zhou, D.-Q., & Leung, K.-C. 1990, ApJ, 355, 271 [NASA ADS] [CrossRef] [Google Scholar]
All Tables
All Figures
|
Fig. 1. Comparison of normalized mean values of key parameters between contact binary systems with low mass ratios (q < 0.25, orange) and higher mass ratios (q ≥ 0.25, blue). Each parameter is scaled to [0, 1] for a direct comparison. |
| In the text | |
|
Fig. 2. Pairwise scatter plots of the orbital period, mass ratio, and fillout factor for the contact binary sample, with KDE on the diagonals. |
| In the text | |
|
Fig. 3. Left: 3D scatter plot of log P, f, and q for the contact binary sample. Systems with q ≲ 0.27 are highlighted in red. Right: Histogram of q. The vertical red line marks the low mass-ratio threshold. |
| In the text | |
|
Fig. 4. (a) Histogram of Jspin/Jorb with a KDE overlay. The vertical line indicates the classical Darwin limit (0.333). (b) Two-dimensional scatter plot of the mass ratio vs. Jspin/Jorb, with uncertainty bands represented by the MAD of the MC realizations. |
| In the text | |
|
Fig. 5. Median values of k22 vs. mass ratio, computed over the mass-ratio intervals listed in Table 1. The shaded regions denote the MAD, and colors encode the corresponding MAD. |
| In the text | |
|
Fig. 6. Scatter plots illustrating correlations between selected stellar parameters in low mass-ratio contact binaries with orbital periods shorter than 0.6 days. The linear regression lines are overlaid. The red lines correspond to fits using mean errors, and the blue lines correspond to fits using errors reported in the literature. The shaded areas indicate the ±1σ uncertainty ranges for each fit. |
| In the text | |
|
Fig. 7. (a) M1, 2 − L1, 2, (b) M1, 2 − R1, 2, (c) Mtot–J0. The diagrams are presented using a logarithmic scale. |
| In the text | |
|
Fig. 8. Hertzsprung-Russel diagram showing the positions of the primary and secondary stars in 115 binary systems with a low mass ratio, illustrating their distribution relative to the ZAMS and TAMS lines. |
| In the text | |
Current usage metrics show cumulative count of Article Views (full-text article views including HTML views, PDF and ePub downloads, according to the available data) and Abstracts Views on Vision4Press platform.
Data correspond to usage on the plateform after 2015. The current usage metrics is available 48-96 hours after online publication and is updated daily on week days.
Initial download of the metrics may take a while.