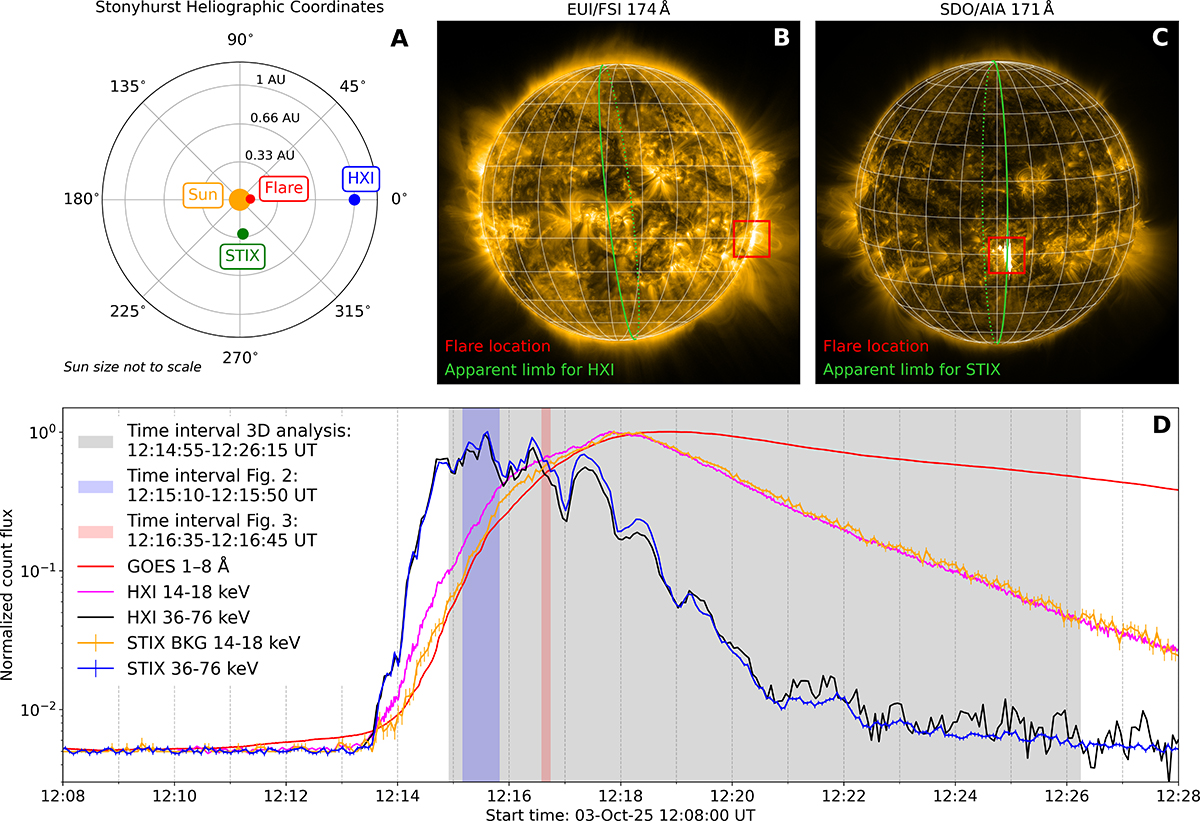
Fig. 1.
Download original image
Overview of the SOL2024-10-03T12:12 event. (A) Schematic illustration (not to scale) showing the relative positions of STIX, HXI, and the flaring region. (B) EUI 174 Å image from Solar Orbiter, with the apparent solar limb as viewed from HXI overlaid in green for reference. (C) Full-disk AIA 171 Å image, with the apparent solar limb from the STIX viewpoint overlaid in green. In panels (B) and (C) the flaring active region is highlighted with a light red square. The EUI and AIA images are observed at 12:16:45 and 12:16:33 UT, respectively. (D) Normalized light curves: GOES 1–8 Å channel (red), STIX 14–18 keV (yellow) as measured by the Background detector (BKG; Krucker et al. 2020), STIX 36–76 keV (blue) as measured by the imaging detectors, HXI 14–18 keV (magenta), and HXI 36–76 keV (black). The shaded gray area indicates the time interval considered in the analysis, while the shaded blue and red areas indicate the time ranges considered for the reconstructions of Figures 2 and 3, respectively. Times are expressed as light arrival times at Earth.
Current usage metrics show cumulative count of Article Views (full-text article views including HTML views, PDF and ePub downloads, according to the available data) and Abstracts Views on Vision4Press platform.
Data correspond to usage on the plateform after 2015. The current usage metrics is available 48-96 hours after online publication and is updated daily on week days.
Initial download of the metrics may take a while.