Fig. 4.
Download original image
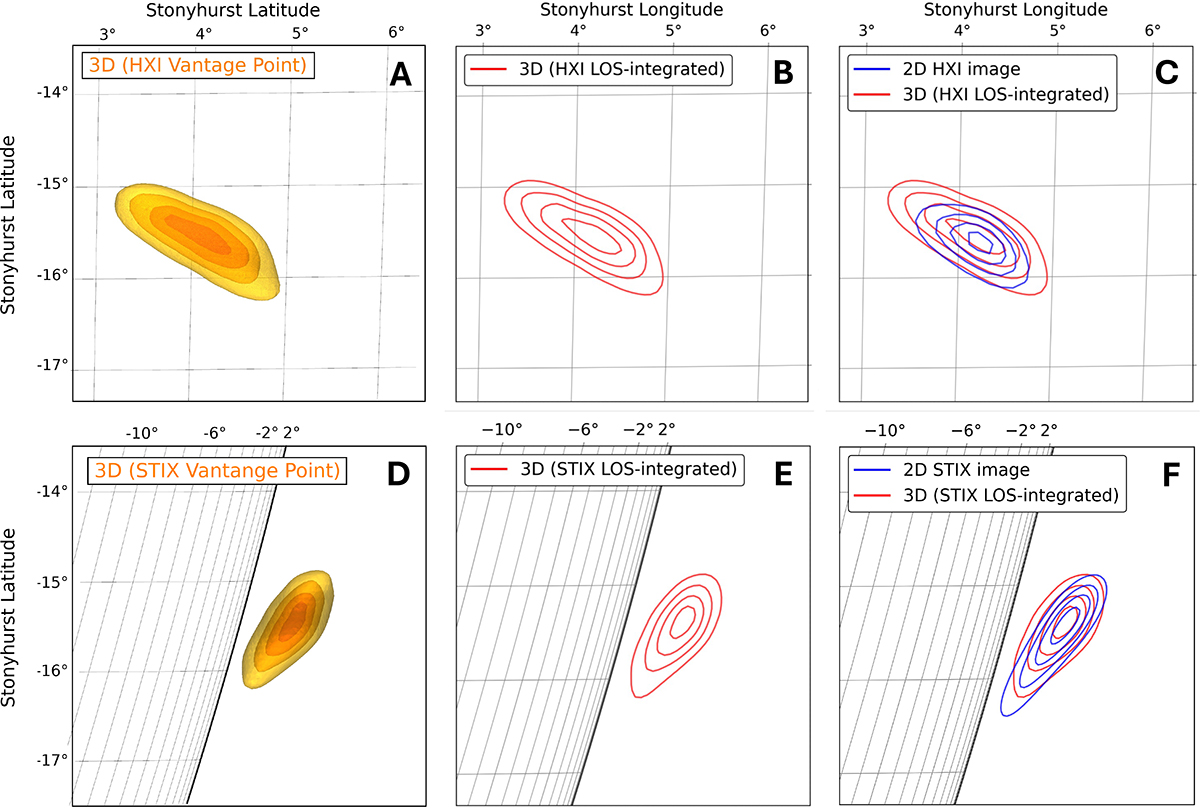
Comparison between 3D and 2D reconstructions of the thermal flare emission in the 14–18 keV energy band at 12 : 16 : 35 UT. Panels A–C show the HXI viewpoint: (A) 3D reconstruction viewed from the HXI perspective; (B) contour levels of the 3D reconstruction integrated along the HXI LOS; (C) contours of the 3D reconstruction integrated along the HXI LOS (red) and of the 2D reconstruction obtained from HXI data only (blue). Panels D–F are the same as A–C but for the STIX viewpoint: (D) 3D reconstruction; (E) contour levels of the 3D reconstruction integrated along the STIX LOS; (F) contours of the 3D reconstruction integrated along the STIX LOS (red) and of the 2D reconstruction obtained from STIX data only (blue). All contour levels and isosurfaces correspond to 30%, 50%, 70%, and 90% of the respective peak intensity. The associated movie is available online.
Current usage metrics show cumulative count of Article Views (full-text article views including HTML views, PDF and ePub downloads, according to the available data) and Abstracts Views on Vision4Press platform.
Data correspond to usage on the plateform after 2015. The current usage metrics is available 48-96 hours after online publication and is updated daily on week days.
Initial download of the metrics may take a while.