Fig. 5.
Download original image
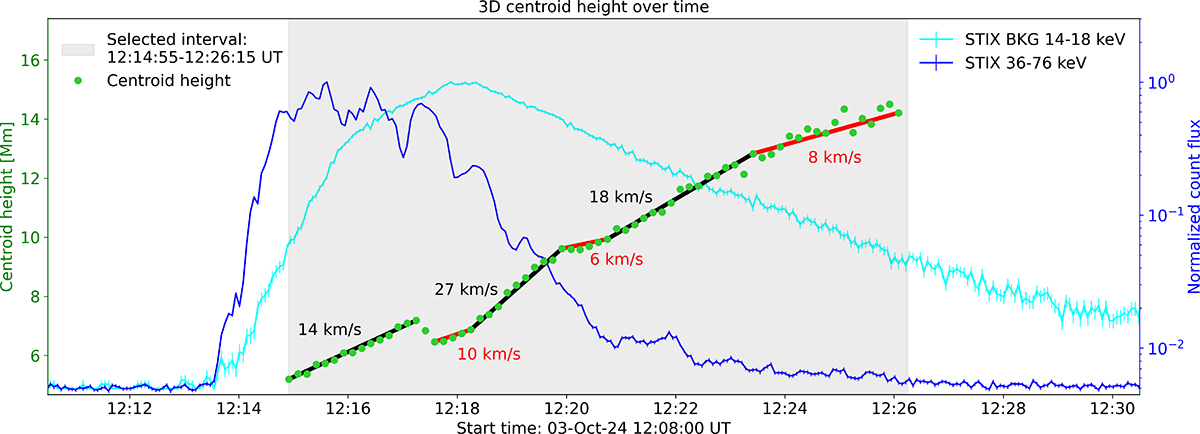
Temporal evolution of the 3D centroid height above the solar surface for the flare SOL2024-10-03T12:12. The individual height values are plotted as green circles, while the average radial velocities for several identified time ranges are indicated both in black and in red. Each velocity value corresponds to the average speed between the first and the last time step of each black or red line, which indicates a time range with approximately constant velocity. As a reference, the STIX light curves for the 14–18 keV and for the 36–76 keV energy ranges are plotted in cyan and in blue, respectively. The left and right vertical axes refer to the centroid height and the normalized STIX flux, respectively.
Current usage metrics show cumulative count of Article Views (full-text article views including HTML views, PDF and ePub downloads, according to the available data) and Abstracts Views on Vision4Press platform.
Data correspond to usage on the plateform after 2015. The current usage metrics is available 48-96 hours after online publication and is updated daily on week days.
Initial download of the metrics may take a while.