Fig. B.2.
Download original image
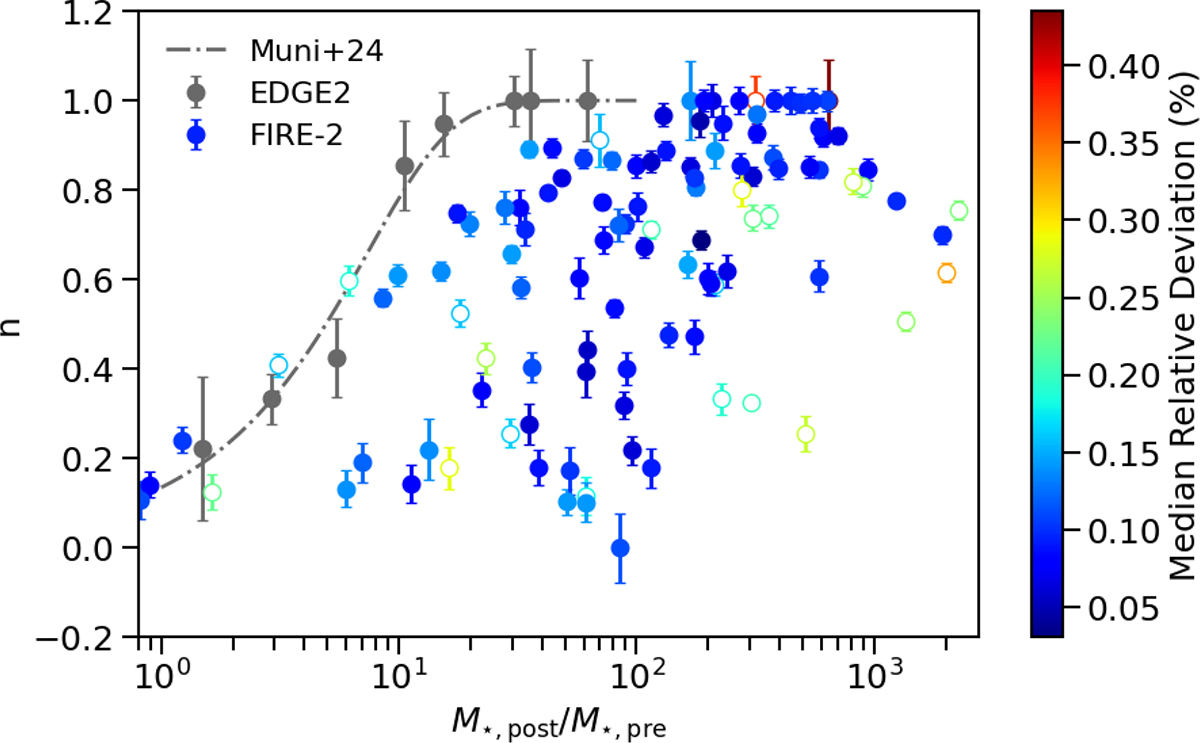
n parameter of the coreNFW profile versus the ratio of stellar mass formed after and before re-ionisation. Grey circles with error bars show the results for EDGE2 galaxies and coloured plots indicate the fitted values for galaxies from the FIRE-2 suite. Colours indicate the fit quality via the median deviation of the model relative to the data. Galaxies with median relative deviation over 0.15% are displayed as empty circles, indicating unreliable fitting around the core radius. The dot-dashed grey line represents the fit to the EDGE2 simulations reported by Muni et al. (2024).
Current usage metrics show cumulative count of Article Views (full-text article views including HTML views, PDF and ePub downloads, according to the available data) and Abstracts Views on Vision4Press platform.
Data correspond to usage on the plateform after 2015. The current usage metrics is available 48-96 hours after online publication and is updated daily on week days.
Initial download of the metrics may take a while.