| Issue |
A&A
Volume 710, June 2026
|
|
|---|---|---|
| Article Number | A95 | |
| Number of page(s) | 11 | |
| Section | Extragalactic astronomy | |
| DOI | https://doi.org/10.1051/0004-6361/202558718 | |
| Published online | 03 June 2026 | |
The impact of star formation histories on the inner dark matter density slopes of galaxies
1
Instituto de Astrofísica de Canarias (IAC), Calle Via Láctea s/n, E-38205 La Laguna, Tenerife, Spain
2
Universidad de La Laguna, Avda. Astrofísico Fco. Sánchez s/n, E-38206 La Laguna, Tenerife, Spain
3
Department of Physics & Astronomy, University of Southern California, Los Angeles, CA 90089, USA
4
New York University Abu Dhabi, PO Box 129188 Abu Dhabi, United Arab Emirates
5
Center for Astrophysics and Space Science, New York University Abu Dhabi, Abu Dhabi, PO Box 129188 Abu Dhabi, UAE
★ Corresponding author: This email address is being protected from spambots. You need JavaScript enabled to view it.
Received:
22
December
2025
Accepted:
26
April
2026
Abstract
Aims. We aim to investigate the connection between star formation histories (SFHs) and the inner dark matter density profiles of simulated galaxies. In particular, we tested whether the burstiness and temporal distribution of star formation influence the formation of cored versus cuspy dark matter profiles.
Methods. We homogeneously analysed simulated galaxies from the NIHAO and FIRE-2 projects. For each galaxy, we derived dark matter density profiles and measured the logarithmic slope in the inner region of the dark matter halo (1–2% of Rvir). To characterise the star formation burstiness, we introduced a criterion based on comparing the star formation rate (SFR) averaged over two distinct timescales. We further quantified the temporal concentration of SFHs by computing the ratio of stellar mass formed after versus before the epoch of re-ionisation at redshift z ∼ 6.5, expressed as M★, post/M★, pre.
Results. A homogeneous analysis reveals that inner slope versus stellar-to-halo mass ratio trends for NIHAO and FIRE-2 galaxies are in much better agreement than what has been reported in previous works. The burstiness and post-to-pre re-ionisation stellar mass ratio explain the scatter in the inner slope versus stellar-to-halo mass ratio relation, revealing that galaxies with a burstiness above average and a more extended SFH are more efficient at developing cored dark matter profiles. In contrast, galaxies with smoother SFHs and an earlier stellar mass assembly time tend to maintain cuspier dark matter profiles. We present an analytic expression that improves predictions for the inner slope using M★, post/M★, pre, which reduces the mean square error in both simulation suites relative to previous formulations based solely on the stellar-to-halo mass ratio.
Key words: galaxies: dwarf / galaxies: general / galaxies: halos / galaxies: starburst / galaxies: star formation / galaxies: structure
© The Authors 2026
 Open Access article, published by EDP Sciences, under the terms of the Creative Commons Attribution License (https://creativecommons.org/licenses/by/4.0), which permits unrestricted use, distribution, and reproduction in any medium, provided the original work is properly cited.
This article is published in open access under the Subscribe to Open model. This email address is being protected from spambots. You need JavaScript enabled to view it. to support open access publication.
1. Introduction
Understanding how baryonic processes influence the distribution of dark matter in galaxies is a key objective in the study of galaxy formation and evolution. One of the most studied topics in this area is the discrepancy between the central dark matter profiles predicted by simulations and those inferred from observations of dwarf and low surface brightness galaxies. While cold dark matter-only simulations robustly predict cuspy inner profiles (Navarro et al. 1997), observational studies often find shallower, core-like distributions (de Blok et al. 2001; Oh et al. 2011). This ‘core-cusp’ tension has motivated investigations into the potential for baryonic physics (particularly stellar feedback) to modify the dark matter structure found in cold dark matter-only simulations, especially in the central regions of galaxies.
Numerous theoretical and numerical works have demonstrated that star formation and feedback processes can significantly impact the inner slope of dark matter halos. In particular, the total amount of energy injected by stellar feedback, relative to the total halo mass of the galaxy, plays a critical role in driving dark matter core formation. This property is closely correlated with the stellar-to-halo mass ratio (Peñarrubia et al. 2012; Pontzen & Governato 2012; Brook & Di Cintio 2015). Simulations show that repeated gas outflows associated with star formation can generate potential fluctuations that dynamically heat the dark matter, pushing it outward and flattening the central cusp (Di Cintio et al. 2014a,b; Tollet et al. 2016; Lazar et al. 2020). In particular, Di Cintio et al. (2014b) fit the relationship between the dark matter profile inner slope and the stellar-to-halo mass ratio using Eq. (1), whilst Tollet et al. (2016) and Lazar et al. (2020) used the more complex Eq. (2), with x = M★/Mhalo in both cases. It is worth noting that different studies adopt different halo mass definitions: some compute the halo mass Mhalo using an overdensity of 200 times the critical density of the universe (M200c), whereas others use the virial overdensity (Mvir). In addition, Rhalo is defined as the radius that encloses a total mass of Mhalo according to the adopted overdensity. These studies have revealed that core formation is most efficient in galaxies with intermediate stellar-to-halo mass ratios (M★/Mhalo ∼ 0.005–0.007), thereby providing a useful first-order predictor of halo structure. This can be expressed as
![Mathematical equation: $$ \begin{aligned} \left.\frac{d\log {\rho }}{d\log {r}}\right|_{r = 0.015 R_{\rm halo}} (x)&= n - \log _{10} \left[ \left( \frac{x}{x_{0}}\right)^{-\beta } + \left( \frac{x}{x_{0}}\right)^\gamma \right],\end{aligned} $$](/articles/aa/full_html/2026/06/aa58718-25/aa58718-25-eq1.gif) (1)
(1)
![Mathematical equation: $$ \begin{aligned} \left.\frac{d\log {\rho }}{d\log {r}}\right|_{r = 0.015 R_{\rm halo}} (x)&= n - \log _{10} \left[ n_{1} \left( 1+\frac{x}{x_{1}}\right)^{-\beta } + \left( \frac{x}{x_{0}}\right)^\gamma \right]. \end{aligned} $$](/articles/aa/full_html/2026/06/aa58718-25/aa58718-25-eq2.gif) (2)
(2)
However, while these results emphasise the importance of integrated stellar feedback over cosmic time, the detailed temporal structure of star formation (the extent to which it is bursty or continuous or how much stellar mass is formed before vs. after a given time) might further modulate the effectiveness of this process. Specifically, it has been proposed that bursty star formation, which drives stronger and more abrupt changes in the gravitational potential, might be more effective at reshaping dark matter distributions than smoother, extended star formation histories with a similar total stellar mass (Navarro et al. 1996; Read & Gilmore 2005; Pontzen & Governato 2014). Di Cintio et al. (2017) demonstrated that both the burstiness and overall duration of star formation are key drivers of the structural differences between diffuse and compact galaxies. Systems that experience extended, highly bursty SFHs tend to develop more extended dark matter cores, whereas those with shorter, less bursty SFHs exhibit cuspier central dark matter profiles and smaller effective radii (see their Fig. 4). This motivates the need to quantify burstiness as a distinct parameter, beyond the stellar-to-halo mass ratio, in understanding dark matter core formation.
Apart from burstiness, Muni et al. (2024) highlighted the importance of the temporal concentration of the SFH on the process of core formation. Specifically, they found the ratio of stellar mass that formed after and before the re-ionisation epoch (hereafter referred to as post-to-pre re-ionisation stellar mass ratio) shows a better correlation with the inner dark matter density of dwarf galaxies than the stellar-to-halo mass ratio in the EDGE simulations (Agertz et al. 2019; Rey et al. 2025).
Observational and theoretical efforts have begun to characterise bursty star formation in low-mass galaxies (Weisz et al. 2012; Emami et al. 2019), while cosmological simulations are increasingly able to resolve these time-variable feedback processes. However, the relationship between star formation burstiness and dark matter structure has yet to be systematically quantified. In particular, it remains unclear whether galaxies with similar stellar-to-halo mass ratios, but different star formation histories might exhibit systematically different inner density profiles. There is also the question of whether burstiness can account for the scatter in the observed relation between the M★/Mhalo ratio and the inner slope.
In this paper, we address this gap by homogeneously analysing two suites of simulated galaxies to quantify the burstiness of their SFHs and measure the corresponding slopes of their dark matter density profiles. We show that galaxies with similar stellar mass, but differing degrees of burstiness can present remarkably different inner dark matter structures, with more bursty galaxies tending to produce cored profiles more often. Our results suggest that burstiness introduces an important second-order effect that can help explain the diversity in inner halo slopes. Additionally, we find the post-to-pre re-ionisation stellar mass ratio has a similar effect to that of burstiness on the inner slope of the dark matter profile. By explicitly linking time resolved star formation behaviour to dark matter core formation, this work offers new insight into the role of baryonic feedback in shaping galaxy structure.
The paper is organised as follows. Section 2 introduces the two suites of simulated galaxies that form the basis of our analysis. In Sect. 3, we present the main results from the homogeneous analysis of both suites. This section is structured to first address the relationship between the burstiness metric and the inner dark matter profile slopes (Sect. 3.1). We then investigate the correlation between the post-to-pre re-ionisation stellar mass ratio and the inner dark matter slopes in Sect. 3.2. Section 3.3 reports an improved fitting equation for the inner slope that combines the effects of the stellar-to-halo mass ratio and the post-to-pre re-ionisation stellar mass ratio. Finally, our conclusions are summarised in Sect. 4.
2. Simulations
2.1. The NIHAO project
The Numerical Investigations of Hundred Astrophysical Objects (NIHAO) project is a suite of high resolution cosmological zoom-in hydrodynamical simulations based on the GASOLINE2 code (Wadsley et al. 2017) first presented in Wang et al. (2015). The NIHAO project adopts Planck cosmology (Planck Collaboration XVI 2014), using the following parameters: H0 = 100 h km s−1 Mpc−1 with h = 0.671, Ωm = 0.3175, ΩΛ = 0.6824, Ωb = 0.049, and σ8 = 0.8344 (Wang et al. 2015).
Overall, NIHAO simulations include all fundamental processes involved in galaxy formation. In particular, the implementation of star formation and stellar feedback mechanisms follows the model established in Making Galaxies In a Cosmological Context (MaGICC; Stinson et al. 2013) simulations. This particular framework has proved successful in reproducing a broad range of observed galaxy scaling relations (Brook et al. 2012; Macciò et al. 2012). The suite correctly reproduces the observed stellar mass-halo mass relation and generates a diverse range of realistic morphologies, from irregular dwarfs to well-defined stellar discs in Milky Way-mass systems (Wang et al. 2015). Furthermore, its galaxies are well aligned with the SPARC sample (Santos-Santos et al. 2018) and the Tully-Fisher relation (Dutton et al. 2017). Star formation is activated, according to the Kennicutt–Schmidt Law, in dense gas, satisfying a temperature of T < 1.5 × 10⁴ K and exceeding a density threshold number, set at nth = 10.3 cm−3, using an initial mass function (IMF) from Chabrier (2003).
Stellar feedback is implemented in two distinct epochs. The first involves early stellar feedback from massive stars prior to their supernova explosions (Stinson et al. 2013). In the NIHAO suite, this consists of injecting 13% of the total stellar flux (equivalent to 2 × 1050 erg of thermal energy per M⊙ of the entire stellar population) into the surrounding gas, while leaving radiative cooling enabled. The second epoch consists of supernova feedback from stars in the mass range of 8 − 40 M⊙, which are modelled as collective effects at larger sub-grid scales (typically ∼100 pc to 1 kpc). This feedback is modelled using a thermal blast-wave approach (Stinson et al. 2006). Because the gas receiving the energy is dense, cooling is artificially delayed for particles inside the blast region for ∼30 Myr to prevent numerical over-cooling.
Gas evolution includes metal-line cooling, photoionisation, and ultraviolet heating, based on the prescriptions detailed in Shen et al. (2010). Specifically, the ultraviolet background is implemented via the Haardt & Madau (2012) model, which leads to the complete ionisation of hydrogen in the intergalactic medium by z ∼ 6.7.
The mass and spatial resolution of the simulations allow for the inner structure of galaxies to be resolved down to below 1% of the virial radius (e.g. Tollet et al. 2016). Half-light radii are well captured, with spatial resolutions ranging from about 100 pc in low-mass systems to 800 pc in the most massive galaxies. Individual particle masses scale with the total mass of the simulated galaxy, spanning 6 × 10² to 3 × 10⁵ M⊙ for baryons and 3 × 10³ to 2 × 10⁶ M⊙ for dark matter in the highest-resolution zoom-in region. The simulation achieves high temporal precision, with star formation computed at intervals of 0.84 Myr (Dutton et al. 2019). Meanwhile, the maximum time step for force calculations is 13.5 Myr, with adaptive refinement allowing for steps as small as 12.9 yr depending on local particle acceleration. We used Amiga Halo Finder (AHF Knollmann & Knebe 2009) and selected the main isolated halo from each zoom-in simulation as long as it contained at least one hundred star particles, resulting in a sample of 93 galaxies.
2.2. The FIRE project
The FIRE project comprises several sets of cosmological zoom-in simulations generated with the GIZMO (Hopkins 2015) code, using slightly different cosmological parameters depending on the run. Some follow the Planck cosmology (Planck Collaboration XVI 2014), while others adopt parameters from the Assembling Galaxies Of Resolved Anatomy (AGORA; Kim et al. 2014) project: H0 = 100 h km s−1 Mpc−1 with h = 0.702, Ωm = 0.272, ΩΛ = 0.728, Ωb = 0.0455, and σ8 = 0.807.
Specifically, we used the FIRE-2 simulations (Hopkins et al. 2018), which includes a detailed model of galaxy formation physics. These simulations produce a realistic diversity of Milky Way-mass morphologies, ranging from thin, rotationally supported stellar discs to compact, bulge-dominated systems (Garrison-Kimmel et al. 2018). Furthermore, the model matches the observed structural scaling relations of Local Group dwarf galaxies, including their stellar half-mass radii and velocity dispersions (Fitts et al. 2017). FIRE-2 is noted for capturing the multiphase interstellar medium and generating realistic star formation histories and metallicity gradients without parameter fine-tuning. It naturally produces the low surface brightness and large effective radii characteristic of local dwarf populations through stellar feedback-driven galactic expansion (Chan et al. 2018). While the simulations match observed scaling relations for angular momentum and the Tully-Fisher relation, gas in low-mass systems is found to be more dispersion-supported than typical observed galaxies (El-Badry et al. 2017, 2018). On top of a density threshold of nth = 1000 cm−3, star formation is restricted to occur only when gas is self-gravitating, self-shielding and Jeans unstable. Once a star particle forms, it is treated as a single stellar population with an age, metallicity, and mass inherited from its progenitor gas particle. Feedback quantities are tabulated directly (no fine-tuning) from standard STARBURST99 stellar population models (Leitherer et al. 1999) assuming a Kroupa (2001) IMF.
Feedback in FIRE-2 is implemented through a combination of several resolved channels: continuous stellar mass-loss, photoionisation, photoelectric heating, radiation pressure, and supernovae (Types Ia and II). Crucially, FIRE-2 mass and time resolution are sufficient to explicitly treat individual supernova explosions as discrete events rather than continuous energy injection. The code calculates the exact Sedov–Taylor solution for an energy-conserving spherical shock; if the resolved coupling radius between the star and gas is smaller than the cooling radius, the energy is injected thermally and the subsequent expansion is physically resolved. However, if the coupling radius is larger than the cooling radius, only the terminal momentum is deposited to account for the momentum-conserving phase that occurred at unresolved scales. This allows the simulation to resolve the multi-phase structure of the interstellar medium by affecting baryons directly at small scales (∼1 − 10 pc) without ever turning off gas cooling. Re-ionisation is treated via the uniform ultraviolet background of Faucher-Giguère et al. (2009), leading to a fully ionised hydrogen intergalactic medium by z ∼ 6. These simulations reach high spatial resolution, with gravitational softening lengths of the order of 1–10 pc. The simulations also feature exceptional mass resolution, with minimum baryonic particle masses ranging from 30 to 7 × 10³ M⊙, and dark matter particles spanning 200 to 4 × 10⁴ M⊙. The minimum time steps are of the order of 100 yr and the maximum time step allowed for star particles is of the order of 104 yr.
The FIRE-2 simulations have been shown to reproduce a broad range of observed galaxy properties. As demonstrated in Hopkins et al. (2018), these include realistic star formation histories, gas distributions, metallicity profiles, morphologies, and rotation curves, as well as stellar mass scaling relations.
We use the FIRE-2 cosmological zoom-in simulations presented in Hopkins et al. (2018) and in Graus et al. (2019), on top of high-resolution runs from Wheeler et al. (2019). Halos were again identified using AHF. Exploiting the higher resolution of the FIRE-2 simulations and aiming to improve the statistical robustness of our analysis, we did not restrict our selection to the primary halo in each simulation. Instead, for each simulation, we considered the ten halos containing the largest number of particles. From these, we kept only those composed of at least 99% high-resolution particles and containing a minimum of a hundred star particles. Applying these criteria resulted in a sample of 109 isolated galaxies.
2.3. Previous comparisons
Previous studies have compared the NIHAO and FIRE simulation suites to assess how their different numerical treatments of stellar feedback impact galaxy evolution. A primary focus of these comparisons is the cusp-to-core transformation in dark matter density profiles. Both NIHAO and FIRE-2 successfully reproduce the flattening of central dark matter distributions, transforming the cuspy profiles into cores (Tollet et al. 2016; Lazar et al. 2020). While both suites agree on the integrated mass profiles, the physical drivers differ. FIRE-2 is characterised by more bursty star formation that causes rapid fluctuations in the gravitational potential, whereas NIHAO relies on the large-scale energy injection of the thermal blast-wave model (Tollet et al. 2016; Chen et al. 2024).
Recent comparisons using identical initial conditions reveal that while both codes produce similar final disc morphologies, they differ significantly in their circumgalactic medium properties (Chen et al. 2024). NIHAO (GASOLINE) is characterised by generalised, long-term outflows that suppress inter-galactic medium accretion, while FIRE-2 (GIZMO) presents quasi-virialised hot gas halos formed by the interaction of inflows and feedback-driven outflows (Chen et al. 2024).
3. Results
We defined the virial radius, Rvir, as the radius enclosing a mean density equal to Δvir times the critical density of the universe,  , where H is the Hubble parameter and G is the gravitational constant. The value of Δvir was calculated using the redshift-dependent prescription from Bryan & Norman (1998), evaluated at z = 0. The virial mass was then obtained by summing the masses of all particles within Rvir and the stellar mass was computed as the total mass of stellar particles within 0.1 Rvir.
To characterise the inner slope of the dark matter density profile, we computed a linear fit to the logarithmic density profile between 1% and 2% of Rvir, as in Di Cintio et al. (2014a,b). For this purpose, we adopted the approach from Lazar et al. (2020) to construct dark matter density profiles using 35 logarithmically spaced radial bins between 0.005 Rvir and Rvir. This method was consistently applied to both NIHAO and FIRE-2 galaxies, differing from the binning used for the analysis of NIHAO simulations presented by Tollet et al. (2016).
In Fig. 1, we present the dark matter profile inner slope (measured between 1% and 2% of Rvir) as a function of the stellar-to-halo mass ratio. We fit each set of simulations independently using Eq. (2) and we provide the fit parameters in Table 1. Our results align well with previous findings for FIRE-2 simulations (Lazar et al. 2020) but notable discrepancies exist between our results for NIHAO simulations and those reported in (Tollet et al. 2016). This mismatch arises from the difference in the definition of virial overdensity used for the analysis, since they adopted the value Δ = 200c1. The radius R200c is smaller than Rvir, while the slope measured by taking it as a reference is inherently more cored than it would by using Rvir. In Fig. A.1 we show our results when matching this different overdensity definition. Even for FIRE-2 simulations, we note slight discrepancies with the fit from the literature. Some possible origin of these differences could be the algorithm used for centring galaxies or the specific selection of galaxies, as our sample includes more galaxies than in previous works for both simulation suites. Tollet et al. (2016) uses ∼70 of the NIHAO simulations from our more complete sample. Lazar et al. (2020) only considered the main halo of each FIRE-2 simulation, except for previously identified additional galaxies found in Graus et al. (2019), standing in contrast to our previously described selection method. In addition, they used some runs with the same initial conditions, but at different resolutions; whereas we only use the highest resolution available for each run.
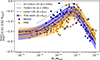 |
Fig. 1. Inner slope of the dark matter density profile, measured between 1% and 2% of the virial radius, as a function of the stellar-to-halo mass ratio. Results are shown for galaxies from the NIHAO (blue) and FIRE-2 (orange) simulations. Solid lines represent fits following Eq. (2) with parameters from Table 1 and the 1σ scatter around the fits is indicated with shadowed regions. The trends are compared to literature fits from Di Cintio et al. (2014b), Tollet et al. (2016) and Lazar et al. (2020). |
After homogenising the analysis across NIHAO and FIRE-2 galaxies, the relation for both simulation suites is in much closer agreement than it could be inferred from previous works, where the trends derived in Tollet et al. (2016) and Lazar et al. (2020) were compared without taking into account the differences in the analysis. Whilst previous relations indicated that NIHAO galaxies are more efficient at developing shallow dark matter profiles, our results reveal that both simulation suites are capable of forming strong cores. The 1σ scatter around the relation is also similar: 0.25 for NIHAO and 0.27 for FIRE-2. However, some systematic differences between the two simulation suites remain: whereas we find the peak efficiency of core formation for NIHAO galaxies at M★/Mvir ∼ 0.005, FIRE-2 galaxies present their highest count of cored dark matter profiles at M★/Mvir ∼ 0.008.
3.1. Burstiness
To quantify burstiness in a galaxy’s SFH, we defined a starburst phase using the following criterion:
 (3)
(3)
This is conceptually similar to the approach in Sparre et al. (2017), although we used longer time windows (50 and 500 Myr, compared to their 10 and 200 Myr). Using this definition, we calculated a metric: the bursty mass fraction (fM, burst), defined as the fraction of a galaxy’s stellar mass formed during starburst phases.
Figure 2 shows how this quantity varies with stellar mass. Figure C.2 presents the SFH of five NIHAO galaxies of different stellar masses, illustrating visually the dependence between burstiness and stellar mass. Compared to the results in Sparre et al. (2017), our criterion produces a more gradually decreasing trend with stellar mass for FIRE-2 galaxies (they did not analyse NIHAO galaxies), which can be well approximated by a second-degree polynomial. To characterise individual deviations from this trend, we defined the burst deviation as the difference between a galaxy’s bursty mass fraction and the value predicted from the polynomial fit at its stellar mass. This deviation quantifies how much more or less bursty a galaxy is than expected for its stellar mass.
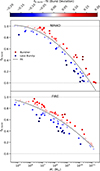 |
Fig. 2. Bursty mass fractions as a function of stellar mass for galaxies in NIHAO (top) and FIRE-2 (bottom) simulation suites. Dashed black lines show the result of fitting the bursty mass fraction to the stellar mass with a second-degree polynomial. Circles are coloured by their absolute deviation from the fit, which we define as burst deviation. |
In Fig. 3, we plot the inner slope of the dark matter density profile as a function of the stellar-to-halo mass ratio for both NIHAO and FIRE-2 galaxies. This time, each galaxy is coloured by its burst deviation. We fit separate trends using Eq. (2) for galaxies with positive (more bursty than expected) and negative (less bursty than expected), yielding the parameters in Table 2.
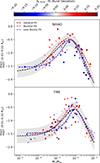 |
Fig. 3. Inner slope of the dark matter density profile, measured between 1% and 2% of the virial radius, as a function of the stellar-to-halo mass ratio. Top panel: Results for the NIHAO suite. Bottom panel: Same but for galaxies from the FIRE-2 dataset. Circles for each galaxy are colour coded by their burst deviation (the difference between actual and expected bursty mass fraction at a given stellar mass). Separate fits are shown for galaxies with above- (dashed red lines) and below- (dashed blue lines) average burstiness. Dashed black lines show the fits to the full sample of galaxies from each suite and grey bands represent the 1σ scatter around the fit. All fits follow Eq. (2) with parameters shown in Table 2. |
For NIHAO galaxies, the trend is clear: galaxies that are burstier than the average for their stellar mass are more likely to exhibit cored dark matter profiles. The trend is similar in the FIRE-2 sample for mass ratios at and just below the peak in core formation (M★/Mvir ∼ 0.005–0.008), but disappears for M★/Mvir > 0.02, where we find a gap in the galaxies from the sample.
3.2. Post-to-pre re-ionisation stellar mass ratio
In addition to burstiness, we explore how the temporal concentration of star formation relative to re-ionisation affects the inner dark matter slope. We define the accumulated stellar mass before and after re-ionisation as
 (4)
(4)
 (5)
(5)
These expressions follow the definitions given in Muni et al. (2024), with zreion = 6.5 (treion = 0.84 Gyr). This approach is motivated by the Faucher-Giguère et al. (2009) ultraviolet background in EDGE/FIRE-2, noting that the re-ionisation timescale in NIHAO is comparable, despite its different background model.
The ratio M★, post/M★, pre acts as a proxy for the temporal concentration of the SFH2 and increases with stellar mass (Fig. 4). As expected, more massive galaxies are more efficient at converting baryons into stars and less affected by feedback due to early star formation episodes, leading to higher M★, post/M★, pre values. This trend is visualised in Fig. C.1. We note that both the NIHAO and FIRE-2 galaxies in our sample are isolated and not subject to quenching due to environmental factors. To quantify the individual deviations from this trend, we defined the SFH deviation as the fractional difference between a galaxy’s M★, post/M★, pre ratio and the value predicted by a second-degree polynomial fit to the stellar mass.
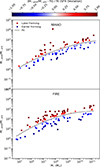 |
Fig. 4. Ratio of post-to-pre re-ionisation stellar mass (M★, post/M★, pre) as a function of total stellar mass for galaxies in NIHAO (top) and FIRE-2 (bottom) simulation suites. Dashed black lines show second-degree polynomial fits. Circles are coloured by their relative deviation from the fit, which we define as SFH deviation. |
We analysed the trends in inner dark matter slope versus stellar-to-halo mass ratio as a function of SFH deviation in Fig. 5, with fit parameters for Eq. (2) listed in Table 3. In both simulation suites, galaxies with extended SFHs (higher M★, post/M★, pre than expected) exhibit shallower dark matter profiles than those with more concentrated, early-time star formation.
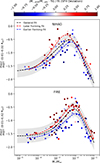 |
Fig. 5. Inner slope of the dark matter density profile, measured between 1% and 2% of the virial radius, as a function of the stellar-to-halo mass ratio. Top panel: Results for the NIHAO suite. Bottom panel: Same but for galaxies from the FIRE-2 dataset. Circles for each galaxy are colour coded by their SFH deviation (the relative difference between actual and expected post-to-pre re-ionisation stellar mass ratio at a given stellar mass). Separate fits are shown for galaxies with more extended (dashed red lines) and less extended (dashed blue lines) SFHs. Dashed black lines show the fits to the full sample of galaxies from each suite and grey bands represent the 1σ scatter around the fit. All fits follow Eq. (2) with parameters shown in Table 3. |
Muni et al. (2024) performed additional analyses of how the M★, post/M★, pre ratio influences dark matter profile shapes, employing alternative coreness indicators rather than the 1–2% Rvir slope used in this work. We reproduce their tests and present the corresponding results in Appendix B.
3.3. Second-order correction to the inner slope fit
We demonstrated that both burstiness and the post-to-pre re-ionisation stellar mass ratio play a role, separate from the stellar-to-halo mass ratio, in shaping the inner region of the dark matter density profile of halos. Our next aim is to use these features to obtain a correction term over the fitting by Eq. (2). We decided to use only one of the features at a time, since we found them to be correlated, as we show in Fig. 6. In that figure, we also notice an outlier galaxy with a very high M★, post/M★, pre value, which can also be observed in Fig. 4. While this galaxy does not introduce any notable effect with respect to the previous analysis, we decide to remove it for the fitting performed in this section.
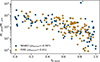 |
Fig. 6. Relation between M★, post/M★, pre and the bursty mass fraction for NIHAO and FIRE-2 galaxies. The Pearson correlation coefficient is indicated in the legend. One outlier NIHAO galaxy, marked with an asterisk, is removed from the calculation. |
We report a two variable fitting formula for the inner slope described by Eq. (6), where x = M★/Mvir and y = M★, post/M★, pre. The inclusion of the additional correction lowers the mean square error in the prediction of the inner slope from 0.073 to 0.055 for FIRE-2 galaxies, and from 0.063 to 0.048 for NIHAO galaxies. We show the fit parameters for each simulation suite in Table 4. In Fig. 7, we visualise the fit by plotting the trend of the inner slope with the stellar-to-halo mass ratio for different values of M★, post/M★, pre. In the figure, we can observe how, for the same ratio of stellar mass to halo mass, galaxies are more likely to present shallower density profiles when they have undergone extended SFHs (high values of M★, post/M★, pre).
![Mathematical equation: $$ \begin{aligned} \left.\frac{d\log {\rho }}{d\log {r}}\right|_{r = 0.015 R_{\rm halo}} (x)&= n - \log _{10} \left[ n_{1} \left( 1+\frac{x}{x_{1}}\right)^{-\beta } + \left( \frac{x}{x_{0}}\right)^\gamma \right]\nonumber \\&\quad + n_{2} y^{\alpha }. \end{aligned} $$](/articles/aa/full_html/2026/06/aa58718-25/aa58718-25-eq7.gif) (6)
(6)
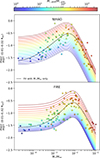 |
Fig. 7. True values (circles) and predictions (lines) for the inner slope of the dark matter density profile as a function of the stellar-to-halo mass ratio for different values of M★, post/M★, pre via the fit by Eq. (6) with the parameters shown in Table 4. Dashed black lines indicate fits using only the stellar-to-halo mass ratio, described by the parameters in Table 1 for Eq. (2). Top panel: Results for the NIHAO suite. Bottom panel: Same but for galaxies from the FIRE-2 dataset. |
4. Conclusions
In this work, we revisit the dependence of the inner slope of dark matter density profiles on the stellar-to-halo mass ratio using homogeneously analysed samples from the NIHAO and FIRE-2 simulations. Our results bring the two suites into closer agreement, showing that careful methodological consistency is essential when comparing simulations and interpreting apparent differences across studies. Whereas earlier comparisons between the analyses of Tollet et al. (2016) and Lazar et al. (2020) suggested that NIHAO galaxies were intrinsically more prone to developing cored dark matter profiles than those in FIRE-2, our homogeneous re-analysis shows that both simulation suites are capable of producing galaxies with similarly cored inner density structures. However, the stellar-to-halo mass ratio at which core formation is most efficient is slightly lower for NIHAO galaxies than for the FIRE-2 suite.
We quantified star formation burstiness by adapting the burst criterion introduced in Sparre et al. (2017), deriving burst mass fractions that trace how concentrated in time star formation is within a galaxy. We find that burstiness decreases systematically with increasing stellar mass in the range M★ ∼ 105 − 1011 M⊙.
To characterise the temporal concentration of SFHs, we employed the M★, post/M★, pre ratio introduced by Muni et al. (2024). In both NIHAO and FIRE-2 galaxies, higher stellar mass systems exhibit more extended SFHs.
By fitting the dependence of burstiness and SFH post-to-pre re-ionisation stellar mass ratio on stellar mass, we identified residuals that highlight galaxies, which are more or less bursty or have longer or shorter SFHs than the average for their mass. These deviations act as secondary predictors of dark matter core formation, beyond the primary role of the stellar-to-halo mass ratio. Specifically, we find that galaxies which are burstier than average develop shallower inner dark matter slopes. Similarly, those with more extended SFHs are more efficient at producing cores. These SFH features explain the existing scatter in the relation between the inner slope and the stellar-to-halo mass ratio in both simulation suites.
We also derived a new fitting formula for the inner slope that includes the contribution of the SFH temporal concentration via the M★, post/M★, pre ratio (Eq. (6)). The addition of a simple term and the joint fitting to data from each simulation revealed higher accuracy than using only the stellar-to-halo mass ratio as a fitting variable, lowering the mean square error from 0.073 to 0.055 for FIRE-2 galaxies and from 0.063 to 0.048 for NIHAO simulations.
Our analysis suggests that burstiness and SFH temporal concentration capture important aspects of the baryonic processes that shape dark matter profiles. However, additional factors, such as the relative strength and timing of starbursts or their spatial distribution within galaxies, are likely to play a significant role. Exploring these features will be the focus of future work.
The predicted relationship between core formation and SFH at fixed stellar mass has significant observational implications. Advances in resolved stellar population studies now enable accurate SFH measurements for low mass galaxies well beyond the virial radius of the Milky Way (e.g. Weisz et al. 2023; Cohen et al. 2025). We predict that galaxies with stellar masses of M★ ∼ 108 M⊙, situated near the peak of core formation efficiency (M★/Mvir ∼ 0.005), should display structural differences driven by their assembly age. Specifically, systems with stellar age distributions biased towards early times are expected to retain cuspier profiles than similar mass galaxies with extended, late time star formation. Observing large cores in objects dominated by early star formation would contradict this prediction, suggesting that feedback mechanisms alone are insufficient and pointing toward alternative scenarios such as self-interacting dark matter (SIDM).
Acknowledgments
JSA thanks the Spanish Ministry of Economy and Competitiveness (MINECO) for support through a grant P/301404 from the Severo Ochoa project CEX2019-000920-S and the Fostering Grads organisation for sponsoring the ECUSA program, which made this international collaboration possible. JSB is supported by NSF grant AST-2408246. CB is supported by the Spanish Ministry of Science and Innovation (MICIU/FEDER) through research grant PID2021-122603NBC22. ADC is supported by the Agencia Estatal de Investigación, under the 2023 call for Ayudas para Incentivar la Consolidación Investigadora, grant number CNS2023-144669, project TINY. The authors wish to acknowledge the contribution of the IAC High-Performance Computing support team and hardware facilities to the results of this research. The freely available software pynbody (Pontzen et al. 2013) has been used for part of this analysis. We thank the FIRE collaboration for making some simulations available for public use (Wetzel et al. 2023, 2025) and for allowing the use of additional ones for this work.
References
- Agertz, O., Pontzen, A., Read, J. I., et al. 2019, MNRAS, 491, 1656 [Google Scholar]
- Brook, C. B., & Di Cintio, A. 2015, MNRAS, 453, 2133 [NASA ADS] [CrossRef] [Google Scholar]
- Brook, C. B., Stinson, G., Gibson, B. K., Wadsley, J., & Quinn, T. 2012, MNRAS, 424, 1275 [CrossRef] [Google Scholar]
- Bryan, G. L., & Norman, M. L. 1998, ApJ, 495, 80 [NASA ADS] [CrossRef] [Google Scholar]
- Chabrier, G. 2003, PASP, 115, 763 [Google Scholar]
- Chan, T. K., Kereš, D., Wetzel, A., et al. 2018, MNRAS, 478, 906 [NASA ADS] [CrossRef] [Google Scholar]
- Chen, H.-Z., Kang, X., Macciò, A. V., Buck, T., & Cen, R. 2024, ApJ, 977, 233 [Google Scholar]
- Cohen, R. E., McQuinn, K. B. W., Savino, A., et al. 2025, ApJ, 981, 153 [Google Scholar]
- de Blok, W. J. G., McGaugh, S. S., & Rubin, V. C. 2001, AJ, 122, 2396 [NASA ADS] [CrossRef] [Google Scholar]
- Di Cintio, A., Brook, C. B., Dutton, A. A., et al. 2014a, MNRAS, 441, 2986 [Google Scholar]
- Di Cintio, A., Brook, C. B., Macciò, A. V., et al. 2014b, MNRAS, 437, 415 [Google Scholar]
- Di Cintio, A., Brook, C. B., Dutton, A. A., et al. 2017, MNRAS, 466, L1 [NASA ADS] [CrossRef] [Google Scholar]
- Dutton, A. A., Obreja, A., Wang, L., et al. 2017, MNRAS, 467, 4937 [Google Scholar]
- Dutton, A. A., Macciò, A. V., Buck, T., et al. 2019, MNRAS, 486, 655 [NASA ADS] [CrossRef] [Google Scholar]
- El-Badry, K., Quataert, E., Wetzel, A., et al. 2017, MNRAS, 473, 1930 [Google Scholar]
- El-Badry, K., Bradford, J., Quataert, E., et al. 2018, MNRAS, 477, 1536 [Google Scholar]
- Emami, N., Siana, B., Weisz, D. R., et al. 2019, ApJ, 881, 71 [NASA ADS] [CrossRef] [Google Scholar]
- Faucher-Giguère, C.-A., Lidz, A., Zaldarriaga, M., & Hernquist, L. 2009, ApJ, 703, 1416 [Google Scholar]
- Fitts, A., Boylan-Kolchin, M., Elbert, O. D., et al. 2017, MNRAS, 471, 3547 [NASA ADS] [CrossRef] [Google Scholar]
- Garrison-Kimmel, S., Hopkins, P. F., Wetzel, A., et al. 2018, MNRAS, 481, 4133 [NASA ADS] [CrossRef] [Google Scholar]
- Graus, A. S., Bullock, J. S., Fitts, A., et al. 2019, MNRAS, 490, 1186 [Google Scholar]
- Haardt, F., & Madau, P. 2012, ApJ, 746, 125 [Google Scholar]
- Hopkins, P. F. 2015, MNRAS, 450, 53 [Google Scholar]
- Hopkins, P. F., Wetzel, A., Kereš, D., et al. 2018, MNRAS, 480, 800 [NASA ADS] [CrossRef] [Google Scholar]
- Kim, J.-H., Abel, T., Agertz, O., et al. 2014, ApJS, 210, 14 [Google Scholar]
- Knollmann, S. R., & Knebe, A. 2009, ApJS, 182, 608 [Google Scholar]
- Kroupa, P. 2001, MNRAS, 322, 231 [NASA ADS] [CrossRef] [Google Scholar]
- Lazar, A., Bullock, J. S., Boylan-Kolchin, M., et al. 2020, MNRAS, 497, 2393 [NASA ADS] [CrossRef] [Google Scholar]
- Leitherer, C., Schaerer, D., Goldader, J. D., et al. 1999, ApJS, 123, 3 [Google Scholar]
- Macciò, A. V., Stinson, G., Brook, C. B., et al. 2012, ApJ, 744, L9 [Google Scholar]
- Muni, C., Pontzen, A., Read, J. I., et al. 2024, MNRAS, 536, 314 [Google Scholar]
- Navarro, J. F., Eke, V. R., & Frenk, C. S. 1996, MNRAS, 283, L72 [NASA ADS] [Google Scholar]
- Navarro, J. F., Frenk, C. S., & White, S. D. M. 1997, ApJ, 490, 493 [Google Scholar]
- Oh, S.-H., de Blok, W. J. G., Brinks, E., Walter, F., & Kennicutt, R. C. 2011, ApJ, 141, 193 [CrossRef] [Google Scholar]
- Peñarrubia, J., Pontzen, A., Walker, M. G., & Koposov, S. E. 2012, ApJ, 759, L42 [CrossRef] [Google Scholar]
- Planck Collaboration XVI. 2014, A&A, 571, A16 [NASA ADS] [CrossRef] [EDP Sciences] [Google Scholar]
- Pontzen, A., & Governato, F. 2012, MNRAS, 421, 3464 [NASA ADS] [CrossRef] [Google Scholar]
- Pontzen, A., & Governato, F. 2014, Nature, 506, 171 [NASA ADS] [CrossRef] [Google Scholar]
- Pontzen, A., Roškar, R., Stinson, G. S., et al. 2013, Astrophysics Source Code Library [record ascl:1305.002] [Google Scholar]
- Read, J. I., & Gilmore, G. 2005, MNRAS, 356, 107 [NASA ADS] [CrossRef] [Google Scholar]
- Read, J. I., Agertz, O., & Collins, M. L. M. 2016, MNRAS, 459, 2573 [NASA ADS] [CrossRef] [Google Scholar]
- Rey, M. P., Taylor, E., Gray, E. I., et al. 2025, MNRAS, 541, 1195 [Google Scholar]
- Santos-Santos, I. M., Di Cintio, A., Brook, C. B., et al. 2018, MNRAS, 473, 4392 [NASA ADS] [CrossRef] [Google Scholar]
- Shen, S., Wadsley, J., & Stinson, G. 2010, MNRAS, 407, 1581 [NASA ADS] [CrossRef] [Google Scholar]
- Sparre, M., Hayward, C. C., Feldmann, R., et al. 2017, MNRAS, 466, 88 [NASA ADS] [CrossRef] [Google Scholar]
- Stinson, G., Seth, A., Katz, N., et al. 2006, MNRAS, 373, 1074 [NASA ADS] [CrossRef] [Google Scholar]
- Stinson, G. S., Brook, C., Macciò, A. V., et al. 2013, MNRAS, 428, 129 [NASA ADS] [CrossRef] [Google Scholar]
- Tollet, E., Macciò, A. V., Dutton, A. A., et al. 2016, MNRAS, 456, 3542 [CrossRef] [Google Scholar]
- Wadsley, J. W., Keller, B. W., & Quinn, T. R. 2017, MNRAS, 471, 2357 [NASA ADS] [CrossRef] [Google Scholar]
- Wang, L., Dutton, A. A., Stinson, G. S., et al. 2015, MNRAS, 454, 83 [NASA ADS] [CrossRef] [Google Scholar]
- Weisz, D. R., Johnson, B. D., Johnson, L. C., et al. 2012, ApJ, 744, 44 [NASA ADS] [CrossRef] [Google Scholar]
- Weisz, D. R., McQuinn, K. B. W., Savino, A., et al. 2023, ApJS, 268, 15 [Google Scholar]
- Wetzel, A., Hayward, C. C., Sanderson, R. E., et al. 2023, ApJS, 265, 44 [NASA ADS] [CrossRef] [Google Scholar]
- Wetzel, A., Samuel, J., Gandhi, P. J., et al. 2025, arxiv e-prints [arXiv:2508.06608] [Google Scholar]
- Wheeler, C., Hopkins, P. F., Pace, A. B., et al. 2019, MNRAS, 490, 4447 [CrossRef] [Google Scholar]
Throughout the text, the expression Δ = 200c denotes an overdensity of 200 times the critical density of the universe, and we use the letter c to explicitly differentiate it from an overdensity of 200 times the average matter density of the universe.
We exclude a small subsample of galaxies lacking star formation prior to z = 6.5, resulting in a final sample of 90 NIHAO and 108 FIRE-2 galaxies.
The radius that encloses 200 dark matter particles.
Appendix A: Analysing the inner slope with Δ = 200c
For this work, we adopted the virial overdensity Δvir defined in Bryan & Norman (1998) to analyse the FIRE-2 and NIHAO simulations homogeneously. Nonetheless, several studies (e.g. Di Cintio et al. 2014b; Tollet et al. 2016) use a fixed overdensity of Δ = 200c to investigate the relation between the inner slope of the dark matter density profile and the stellar-to-halo mass ratio. To facilitate a direct comparison to these works, we repeat our analysis using Δ = 200c. For this purpose, we construct new density profiles analogous to those presented in Fig. 2 of Tollet et al. (2016), employing 56 logarithmically spaced bins spanning the range 0.01–1 R200c.
We again apply Eq. 2 to fit the inner slope of the dark matter density profile, measured between 1–2% R200c, as a function of the stellar-to-halo mass ratio M★/M200c (see the fit parameters in Table A.1). The resulting relation is shown in Fig. A.1. Using the overdensity definition adopted by Tollet et al. (2016) produces a relation more consistent with their results, and galaxies with shallower profiles display even flatter inner slopes due to the more internal measurement radius. The scatter in the relation also increases, reaching 0.27 for NIHAO and 0.29 for FIRE-2. In addition, the stellar-to-halo mass ratio at which the profiles are maximally shallow shifts to higher values: 0.005 for NIHAO and 0.009 for FIRE-2. We note that the NIHAO peak value has increased slightly relative to our previous analysis, even though it rounds to the same value at one significant digit.
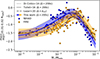 |
Fig. A.1. Inner slope of the dark matter density profile, measured between 1% and 2% of R200c, as a function of the stellar-to-halo mass ratio. Results are shown for galaxies from the NIHAO (blue) and FIRE-2 (orange) simulations. Solid lines represent fits following Eq. 2 and the 1σ scatter around the fits is indicated with shadowed regions. The trends are compared to literature fits from Di Cintio et al. (2014b), Tollet et al. (2016) and Lazar et al. (2020). |
Fit parameters for each set of simulations using Eq. 2 and the overdensity Δ = 200c.
Appendix B: Comparing EDGE and FIRE-2 results
Muni et al. (2024) analysed core formation in EDGE1 and EDGE2 simulations (Agertz et al. 2019; Rey et al. 2025) by measuring the dark matter density at 150 pc from galaxy centres. They reported a tight, decreasing linear relation between the inner dark matter density and the ratio, M★,post/M★,pre. We replicate this analysis using FIRE-2 galaxies to calculate their density within a spherical shell ranging from 125 to 175 pc, with results shown in Fig. B.1. NIHAO galaxies are excluded due to insufficient spatial resolution. For some FIRE-2 galaxies, the 150 pc region lies within the r2003 resolution limit; however, we check that extrapolating the resolved density profile confirms that the inner densities do not significantly deviate from expected values. Additionally, we plot the density at the innermost resolved bin, providing a lower limit for the density at 150 pc.
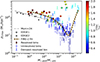 |
Fig. B.1. Dark matter density at 150 pc versus the ratio of stellar mass formed after and before re-ionisation. Grey symbols indicate Muni et al. (2024) results for EDGE galaxies, and the dash-dotted line shows their linear fit. Filled (empty) circles indicate the inner densities of FIRE-2 galaxies that are (un)resolved at 150 pc, with error bars representing Poisson uncertainties associated with the number of dark matter particles used to calculate the inner density. Markers are coloured based on the ratio between 150 pc and r200, a resolution limit marked by the radius enclosing 200 dark matter particles. For unresolved points, horizontal lines provide a lower limit to the inner density by taking the densest resolved bin in the density profile. The dashed orange line represents the fit to the inner densities, including unresolved bins. |
Within the range of M★,post/M★,pre values probed by EDGE simulations, we also recovered a decreasing linear relation between inner density and M★,post/M★,pre. The trend is steeper for FIRE-2 galaxies, which also exhibit higher scatter. At higher M★,post/M★,pre ratios, however, FIRE-2 galaxies show increased inner densities. We attribute this trend change to the broader stellar mass range in our sample. The relation for FIRE-2 galaxies is fitted using Eq. B.1 with x = M★,post/M★,pre. The resulting fitted parameters are: x0 = 2.14 × 10³, n = −6.22 × 10⁻², β = 8.12 × 10⁻², and γ = 1.98. The resulting fitted relation is qualitatively similar to the classical relation between the dark matter density inner slope and the stellar-to-halo mass ratio (see e.g. Fig. 1 and Eq. 1),
![Mathematical equation: $$ \begin{aligned} \frac{\rho _{\rm 150pc}(x)}{10^{9} M_{\odot } kpc^{-3}} = n + \log _{10} \left[ \left( \frac{x}{x_{0}}\right)^{-\beta } + \left( \frac{x}{x_{0}}\right)^\gamma \right]. \end{aligned} $$](/articles/aa/full_html/2026/06/aa58718-25/aa58718-25-eq8.gif) (B.1)
(B.1)
Muni et al. (2024) also reported a tight correlation between the M★,post/M★,pre and the inner slope of the dark matter density profile. They illustrate the dependency using the n variable of the coreNFW profile introduced by Read et al. (2016). In Fig. B.2 we compare their findings with the results of fitting the same profile to our dataset of FIRE-2 galaxies. Following their methodology, we fixed the core radius parameter (rc) of the coreNFW profile to 1.8 times the three dimensional V-band half-light radius of the galaxy to break the degeneracy with the n parameter when fitting the dark matter density profile. Additionally, we fix the halo mass to the value derived from the simulation and constrain n to lie between 0 and 1. We note that the fixed core radius does not provide satisfactory fits for some galaxies in our sample, which span a broader range of stellar and halo properties than the EDGE simulations. Nevertheless, we confirm via visual inspection that the inner slope of the fitted profile generally matches the data. To quantify the fit quality, we compute the median relative deviation of the model from the data, finding that values above ∼0.15 typically indicate unreliable fits near the core radius. Overall, we find that, due to these fitting limitations, the n parameter is less reliable as a tracer of galactic coreness than the directly measured inner slope of the density profile. We notice FIRE-2 galaxies exhibit lower n values (cuspier) than EDGE galaxies for the same M★,post/M★,pre, indicating they require more extended SFHs for developing equally shallow density profiles. On top of that, the relation between n and the post- and pre-reionisation stellar mass ratio is much more disperse for FIRE-2 galaxies, which do not follow a clear trend.
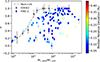 |
Fig. B.2. n parameter of the coreNFW profile versus the ratio of stellar mass formed after and before re-ionisation. Grey circles with error bars show the results for EDGE2 galaxies and coloured plots indicate the fitted values for galaxies from the FIRE-2 suite. Colours indicate the fit quality via the median deviation of the model relative to the data. Galaxies with median relative deviation over 0.15% are displayed as empty circles, indicating unreliable fitting around the core radius. The dot-dashed grey line represents the fit to the EDGE2 simulations reported by Muni et al. (2024). |
Appendix C: Star formation histories
Figure C.1 illustrates the stellar-to-halo mass ratios for stellar populations formed both before (M★, pre/Mvir) and after (M★, post/Mvir) re-ionisation, plotted as a function of total stellar mass (M★). In the low-mass regime, post-reionisation star formation is significantly suppressed by stellar feedback. Conversely, pre-reionisation assembly remains relatively unaffected as feedback has not yet had sufficient time to regulate the interstellar medium. This differential impact results in a widening gap between the Mpost/Mvir and Mpre/Mvir ratios as galaxy mass increases, fundamentally driving the trend observed in Fig. 4
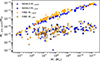 |
Fig. C.1. Stellar-to-virial mass ratios formed pre-reionisation (M★,pre/Mvir, squares) and post-reionisation (M★,post/Mvir, circles) plotted against total stellar mass M★. The values of Mvir and M★ (x-axis) are both measured at z = 0. Data points from the NIHAO and FIRE simulations are highlighted in blue and orange, respectively. |
In Fig. C.2 we present the SFHs of five galaxies from our NIHAO sample to illustrate the calculation process of the bursty mass fraction fM, burst (see Eq. 3) and the post-to-pre re-ionisation stellar mass ratio M★,post/M★,pre.
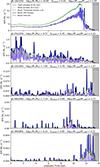 |
Fig. C.2. SFR histories for five representative galaxies from the NIHAO simulation suite, sorted in descending order by their stellar mass. Each panel displays the SFR as a function of lookback time for an individual system. Header labels indicate the galaxy identifier, stellar mass, bursty mass fraction, and the mass ratio M★,post/M★,pre (refer to Sec. 3.1 and 3.2). The grey shaded region denotes z> 6.5, representing the re-ionisation epoch limit. SFRs are calculated using two sliding temporal windows: 0.5 Gyr (orange) and 0.05 Gyr (blue). A dashed green line indicates a burst threshold, defined as 1.5 times the 0.5 Gyr averaged SFR. High-cadence SFR segments exceeding this threshold are highlighted in dark blue, while light red shaded regions indicate the identified SFR burst intervals. |
All Tables
Fit parameters for each set of simulations using Eq. 2 and the overdensity Δ = 200c.
All Figures
|
Fig. 1. Inner slope of the dark matter density profile, measured between 1% and 2% of the virial radius, as a function of the stellar-to-halo mass ratio. Results are shown for galaxies from the NIHAO (blue) and FIRE-2 (orange) simulations. Solid lines represent fits following Eq. (2) with parameters from Table 1 and the 1σ scatter around the fits is indicated with shadowed regions. The trends are compared to literature fits from Di Cintio et al. (2014b), Tollet et al. (2016) and Lazar et al. (2020). |
| In the text | |
|
Fig. 2. Bursty mass fractions as a function of stellar mass for galaxies in NIHAO (top) and FIRE-2 (bottom) simulation suites. Dashed black lines show the result of fitting the bursty mass fraction to the stellar mass with a second-degree polynomial. Circles are coloured by their absolute deviation from the fit, which we define as burst deviation. |
| In the text | |
|
Fig. 3. Inner slope of the dark matter density profile, measured between 1% and 2% of the virial radius, as a function of the stellar-to-halo mass ratio. Top panel: Results for the NIHAO suite. Bottom panel: Same but for galaxies from the FIRE-2 dataset. Circles for each galaxy are colour coded by their burst deviation (the difference between actual and expected bursty mass fraction at a given stellar mass). Separate fits are shown for galaxies with above- (dashed red lines) and below- (dashed blue lines) average burstiness. Dashed black lines show the fits to the full sample of galaxies from each suite and grey bands represent the 1σ scatter around the fit. All fits follow Eq. (2) with parameters shown in Table 2. |
| In the text | |
|
Fig. 4. Ratio of post-to-pre re-ionisation stellar mass (M★, post/M★, pre) as a function of total stellar mass for galaxies in NIHAO (top) and FIRE-2 (bottom) simulation suites. Dashed black lines show second-degree polynomial fits. Circles are coloured by their relative deviation from the fit, which we define as SFH deviation. |
| In the text | |
|
Fig. 5. Inner slope of the dark matter density profile, measured between 1% and 2% of the virial radius, as a function of the stellar-to-halo mass ratio. Top panel: Results for the NIHAO suite. Bottom panel: Same but for galaxies from the FIRE-2 dataset. Circles for each galaxy are colour coded by their SFH deviation (the relative difference between actual and expected post-to-pre re-ionisation stellar mass ratio at a given stellar mass). Separate fits are shown for galaxies with more extended (dashed red lines) and less extended (dashed blue lines) SFHs. Dashed black lines show the fits to the full sample of galaxies from each suite and grey bands represent the 1σ scatter around the fit. All fits follow Eq. (2) with parameters shown in Table 3. |
| In the text | |
|
Fig. 6. Relation between M★, post/M★, pre and the bursty mass fraction for NIHAO and FIRE-2 galaxies. The Pearson correlation coefficient is indicated in the legend. One outlier NIHAO galaxy, marked with an asterisk, is removed from the calculation. |
| In the text | |
|
Fig. 7. True values (circles) and predictions (lines) for the inner slope of the dark matter density profile as a function of the stellar-to-halo mass ratio for different values of M★, post/M★, pre via the fit by Eq. (6) with the parameters shown in Table 4. Dashed black lines indicate fits using only the stellar-to-halo mass ratio, described by the parameters in Table 1 for Eq. (2). Top panel: Results for the NIHAO suite. Bottom panel: Same but for galaxies from the FIRE-2 dataset. |
| In the text | |
|
Fig. A.1. Inner slope of the dark matter density profile, measured between 1% and 2% of R200c, as a function of the stellar-to-halo mass ratio. Results are shown for galaxies from the NIHAO (blue) and FIRE-2 (orange) simulations. Solid lines represent fits following Eq. 2 and the 1σ scatter around the fits is indicated with shadowed regions. The trends are compared to literature fits from Di Cintio et al. (2014b), Tollet et al. (2016) and Lazar et al. (2020). |
| In the text | |
|
Fig. B.1. Dark matter density at 150 pc versus the ratio of stellar mass formed after and before re-ionisation. Grey symbols indicate Muni et al. (2024) results for EDGE galaxies, and the dash-dotted line shows their linear fit. Filled (empty) circles indicate the inner densities of FIRE-2 galaxies that are (un)resolved at 150 pc, with error bars representing Poisson uncertainties associated with the number of dark matter particles used to calculate the inner density. Markers are coloured based on the ratio between 150 pc and r200, a resolution limit marked by the radius enclosing 200 dark matter particles. For unresolved points, horizontal lines provide a lower limit to the inner density by taking the densest resolved bin in the density profile. The dashed orange line represents the fit to the inner densities, including unresolved bins. |
| In the text | |
|
Fig. B.2. n parameter of the coreNFW profile versus the ratio of stellar mass formed after and before re-ionisation. Grey circles with error bars show the results for EDGE2 galaxies and coloured plots indicate the fitted values for galaxies from the FIRE-2 suite. Colours indicate the fit quality via the median deviation of the model relative to the data. Galaxies with median relative deviation over 0.15% are displayed as empty circles, indicating unreliable fitting around the core radius. The dot-dashed grey line represents the fit to the EDGE2 simulations reported by Muni et al. (2024). |
| In the text | |
|
Fig. C.1. Stellar-to-virial mass ratios formed pre-reionisation (M★,pre/Mvir, squares) and post-reionisation (M★,post/Mvir, circles) plotted against total stellar mass M★. The values of Mvir and M★ (x-axis) are both measured at z = 0. Data points from the NIHAO and FIRE simulations are highlighted in blue and orange, respectively. |
| In the text | |
|
Fig. C.2. SFR histories for five representative galaxies from the NIHAO simulation suite, sorted in descending order by their stellar mass. Each panel displays the SFR as a function of lookback time for an individual system. Header labels indicate the galaxy identifier, stellar mass, bursty mass fraction, and the mass ratio M★,post/M★,pre (refer to Sec. 3.1 and 3.2). The grey shaded region denotes z> 6.5, representing the re-ionisation epoch limit. SFRs are calculated using two sliding temporal windows: 0.5 Gyr (orange) and 0.05 Gyr (blue). A dashed green line indicates a burst threshold, defined as 1.5 times the 0.5 Gyr averaged SFR. High-cadence SFR segments exceeding this threshold are highlighted in dark blue, while light red shaded regions indicate the identified SFR burst intervals. |
| In the text | |
Current usage metrics show cumulative count of Article Views (full-text article views including HTML views, PDF and ePub downloads, according to the available data) and Abstracts Views on Vision4Press platform.
Data correspond to usage on the plateform after 2015. The current usage metrics is available 48-96 hours after online publication and is updated daily on week days.
Initial download of the metrics may take a while.