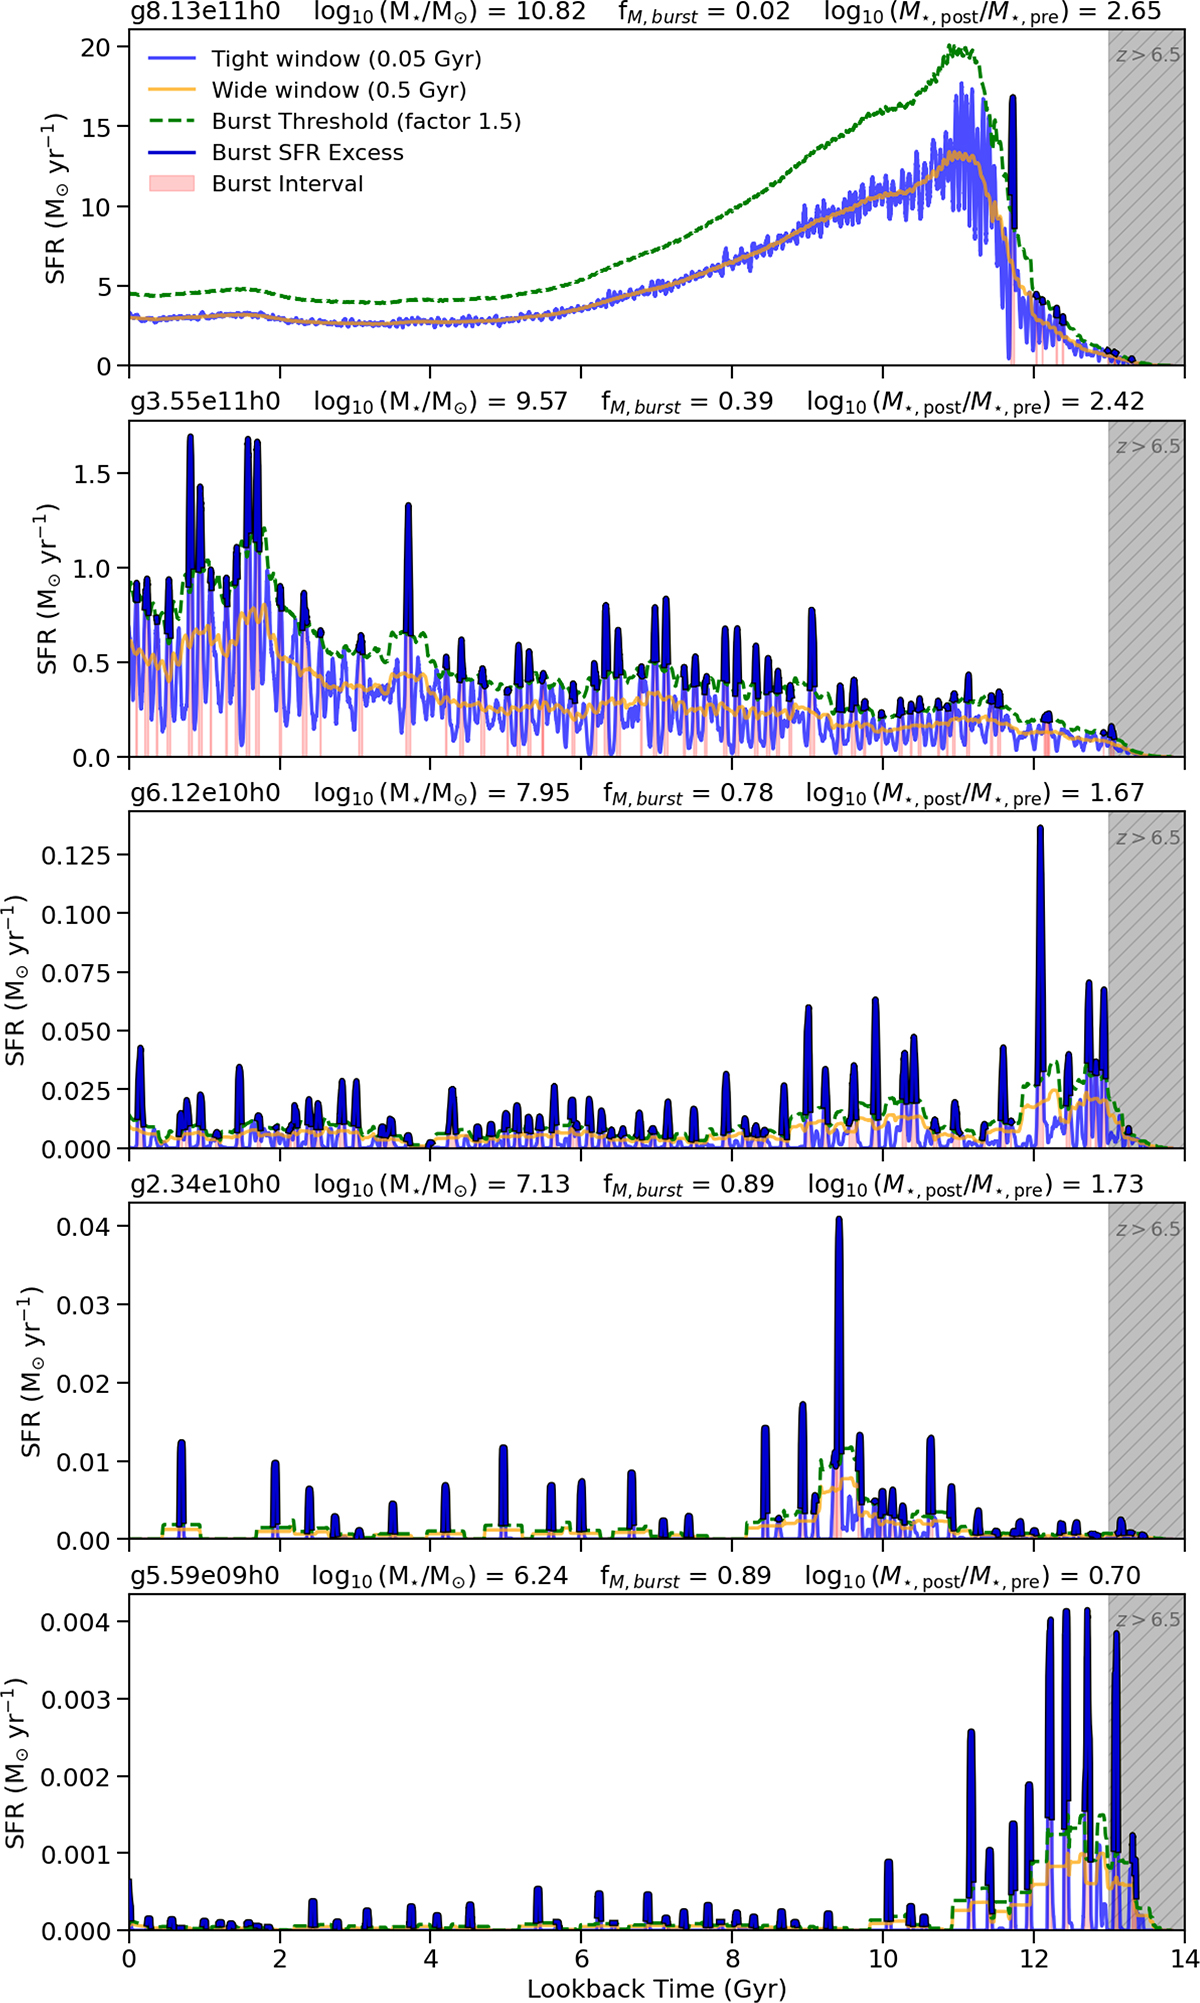
Fig. C.2.
Download original image
SFR histories for five representative galaxies from the NIHAO simulation suite, sorted in descending order by their stellar mass. Each panel displays the SFR as a function of lookback time for an individual system. Header labels indicate the galaxy identifier, stellar mass, bursty mass fraction, and the mass ratio M★,post/M★,pre (refer to Sec. 3.1 and 3.2). The grey shaded region denotes z> 6.5, representing the re-ionisation epoch limit. SFRs are calculated using two sliding temporal windows: 0.5 Gyr (orange) and 0.05 Gyr (blue). A dashed green line indicates a burst threshold, defined as 1.5 times the 0.5 Gyr averaged SFR. High-cadence SFR segments exceeding this threshold are highlighted in dark blue, while light red shaded regions indicate the identified SFR burst intervals.
Current usage metrics show cumulative count of Article Views (full-text article views including HTML views, PDF and ePub downloads, according to the available data) and Abstracts Views on Vision4Press platform.
Data correspond to usage on the plateform after 2015. The current usage metrics is available 48-96 hours after online publication and is updated daily on week days.
Initial download of the metrics may take a while.