Fig. 3.
Download original image
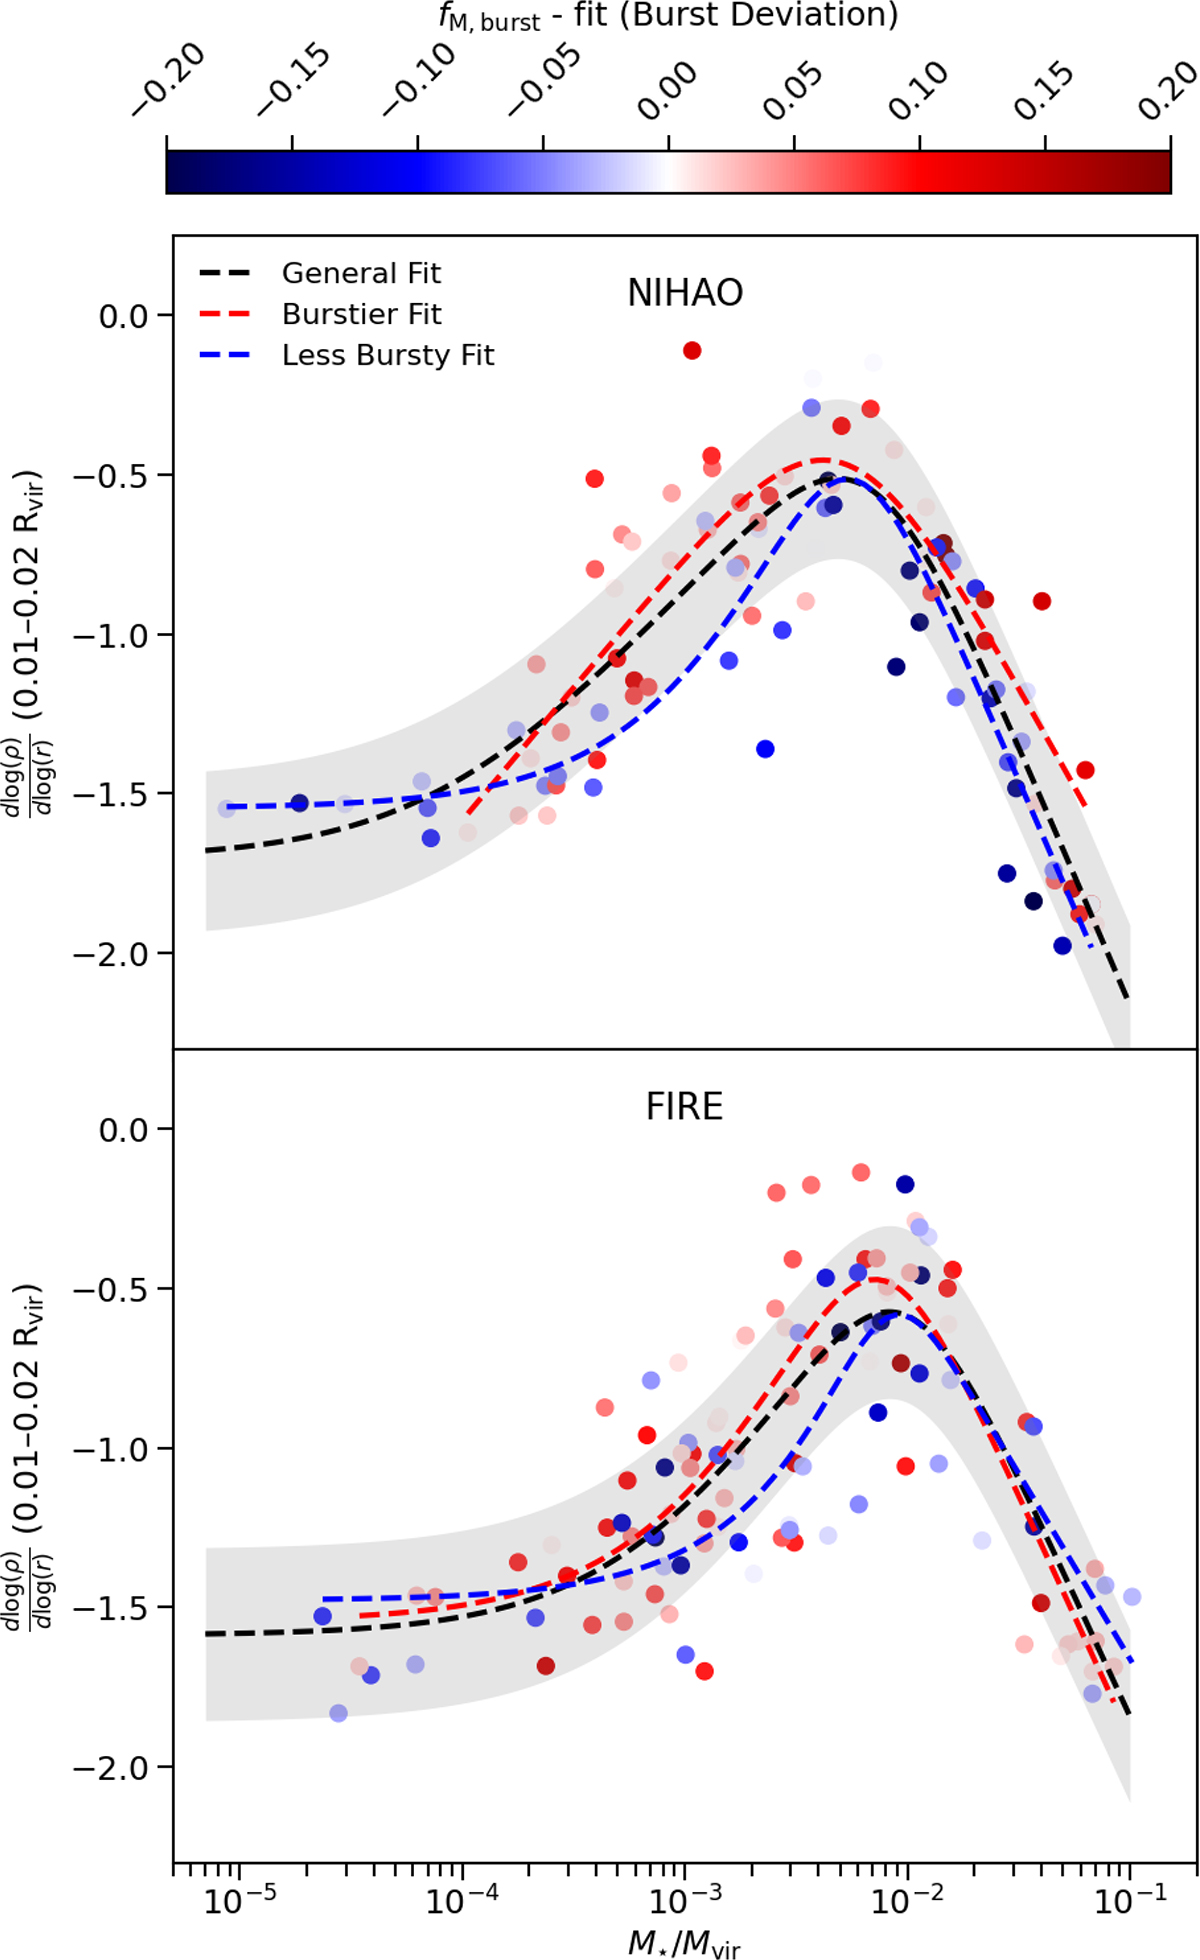
Inner slope of the dark matter density profile, measured between 1% and 2% of the virial radius, as a function of the stellar-to-halo mass ratio. Top panel: Results for the NIHAO suite. Bottom panel: Same but for galaxies from the FIRE-2 dataset. Circles for each galaxy are colour coded by their burst deviation (the difference between actual and expected bursty mass fraction at a given stellar mass). Separate fits are shown for galaxies with above- (dashed red lines) and below- (dashed blue lines) average burstiness. Dashed black lines show the fits to the full sample of galaxies from each suite and grey bands represent the 1σ scatter around the fit. All fits follow Eq. (2) with parameters shown in Table 2.
Current usage metrics show cumulative count of Article Views (full-text article views including HTML views, PDF and ePub downloads, according to the available data) and Abstracts Views on Vision4Press platform.
Data correspond to usage on the plateform after 2015. The current usage metrics is available 48-96 hours after online publication and is updated daily on week days.
Initial download of the metrics may take a while.