Open Access
Fig. 4.
Download original image
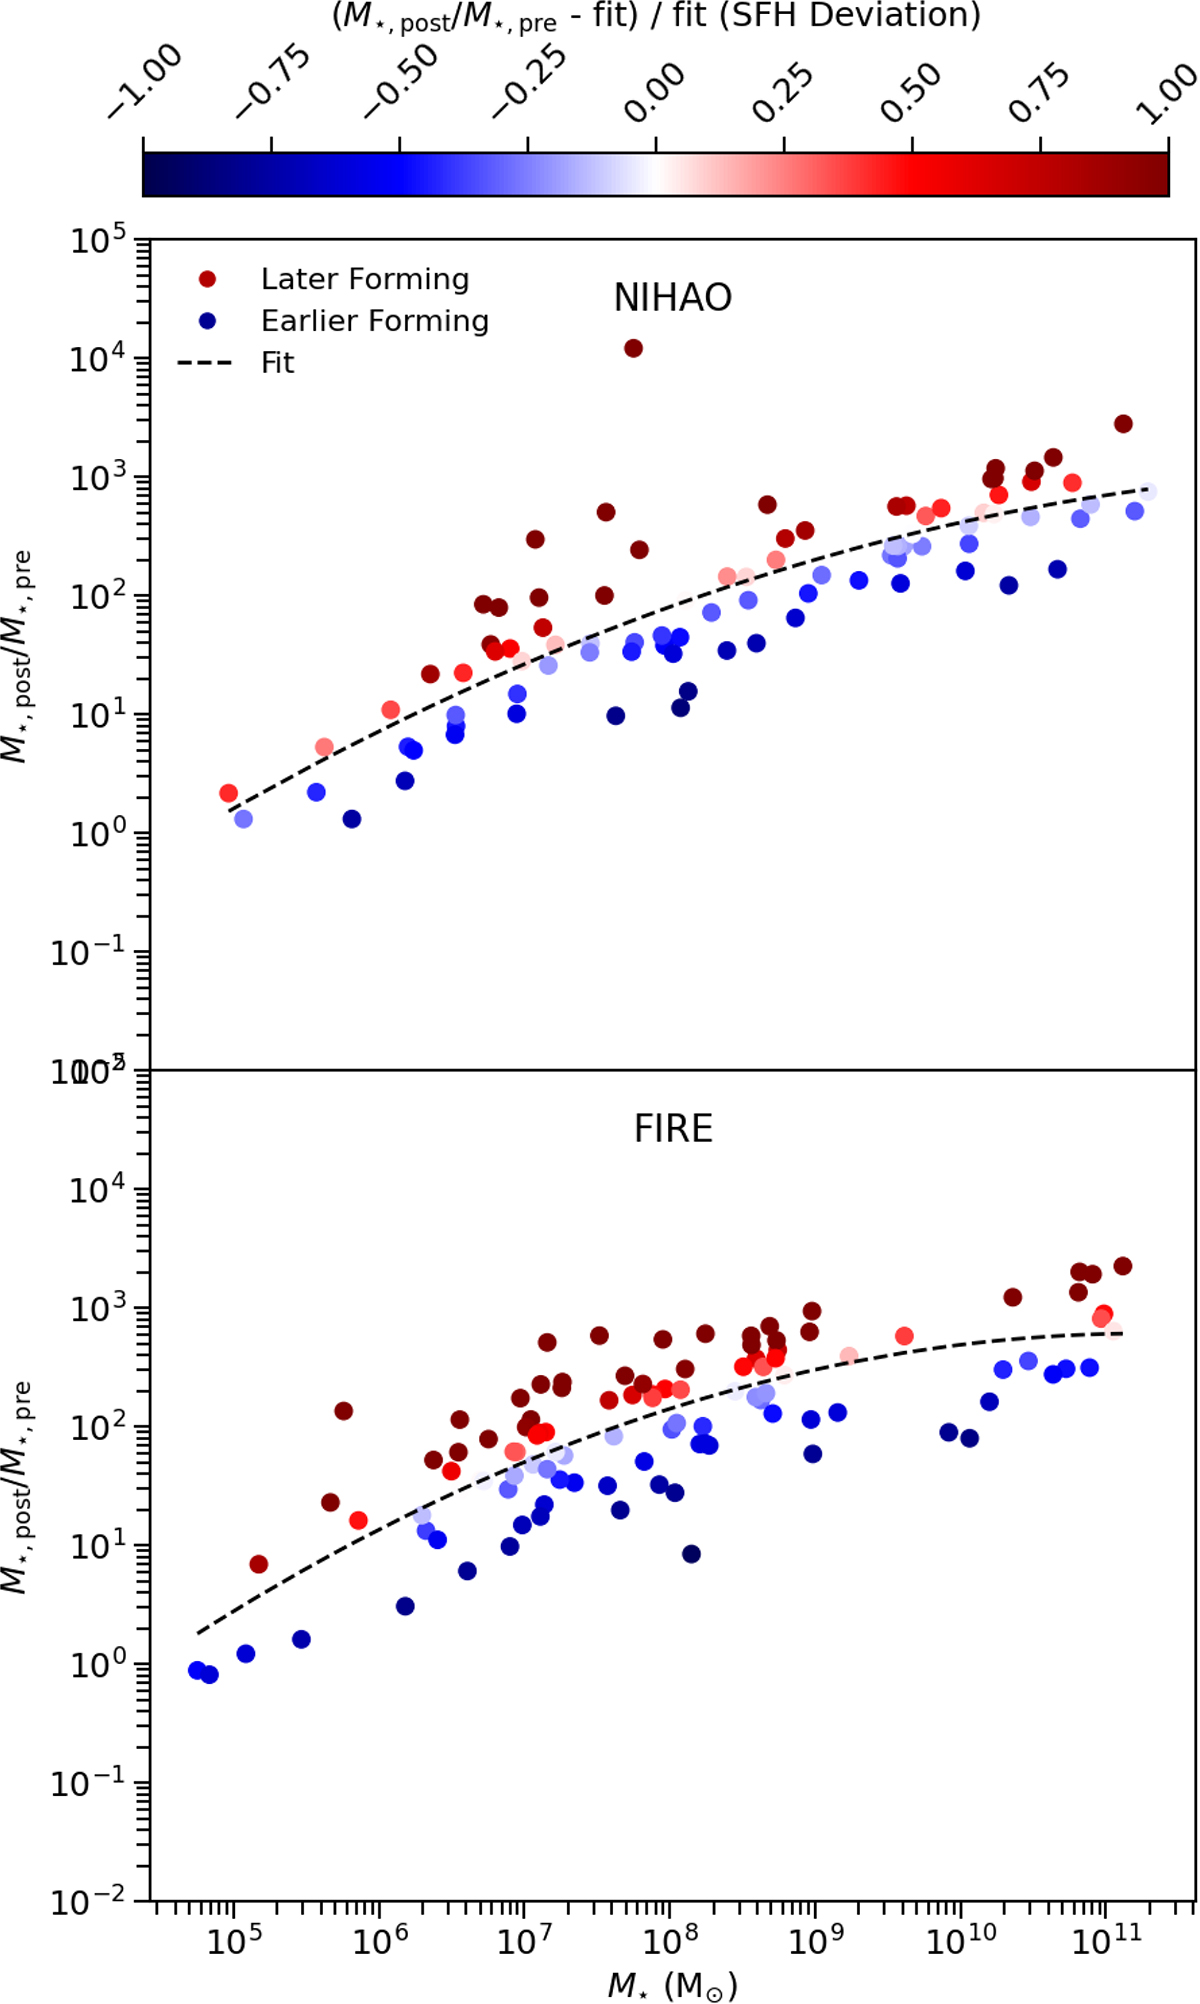
Ratio of post-to-pre re-ionisation stellar mass (M★, post/M★, pre) as a function of total stellar mass for galaxies in NIHAO (top) and FIRE-2 (bottom) simulation suites. Dashed black lines show second-degree polynomial fits. Circles are coloured by their relative deviation from the fit, which we define as SFH deviation.
Current usage metrics show cumulative count of Article Views (full-text article views including HTML views, PDF and ePub downloads, according to the available data) and Abstracts Views on Vision4Press platform.
Data correspond to usage on the plateform after 2015. The current usage metrics is available 48-96 hours after online publication and is updated daily on week days.
Initial download of the metrics may take a while.