Fig. 7.
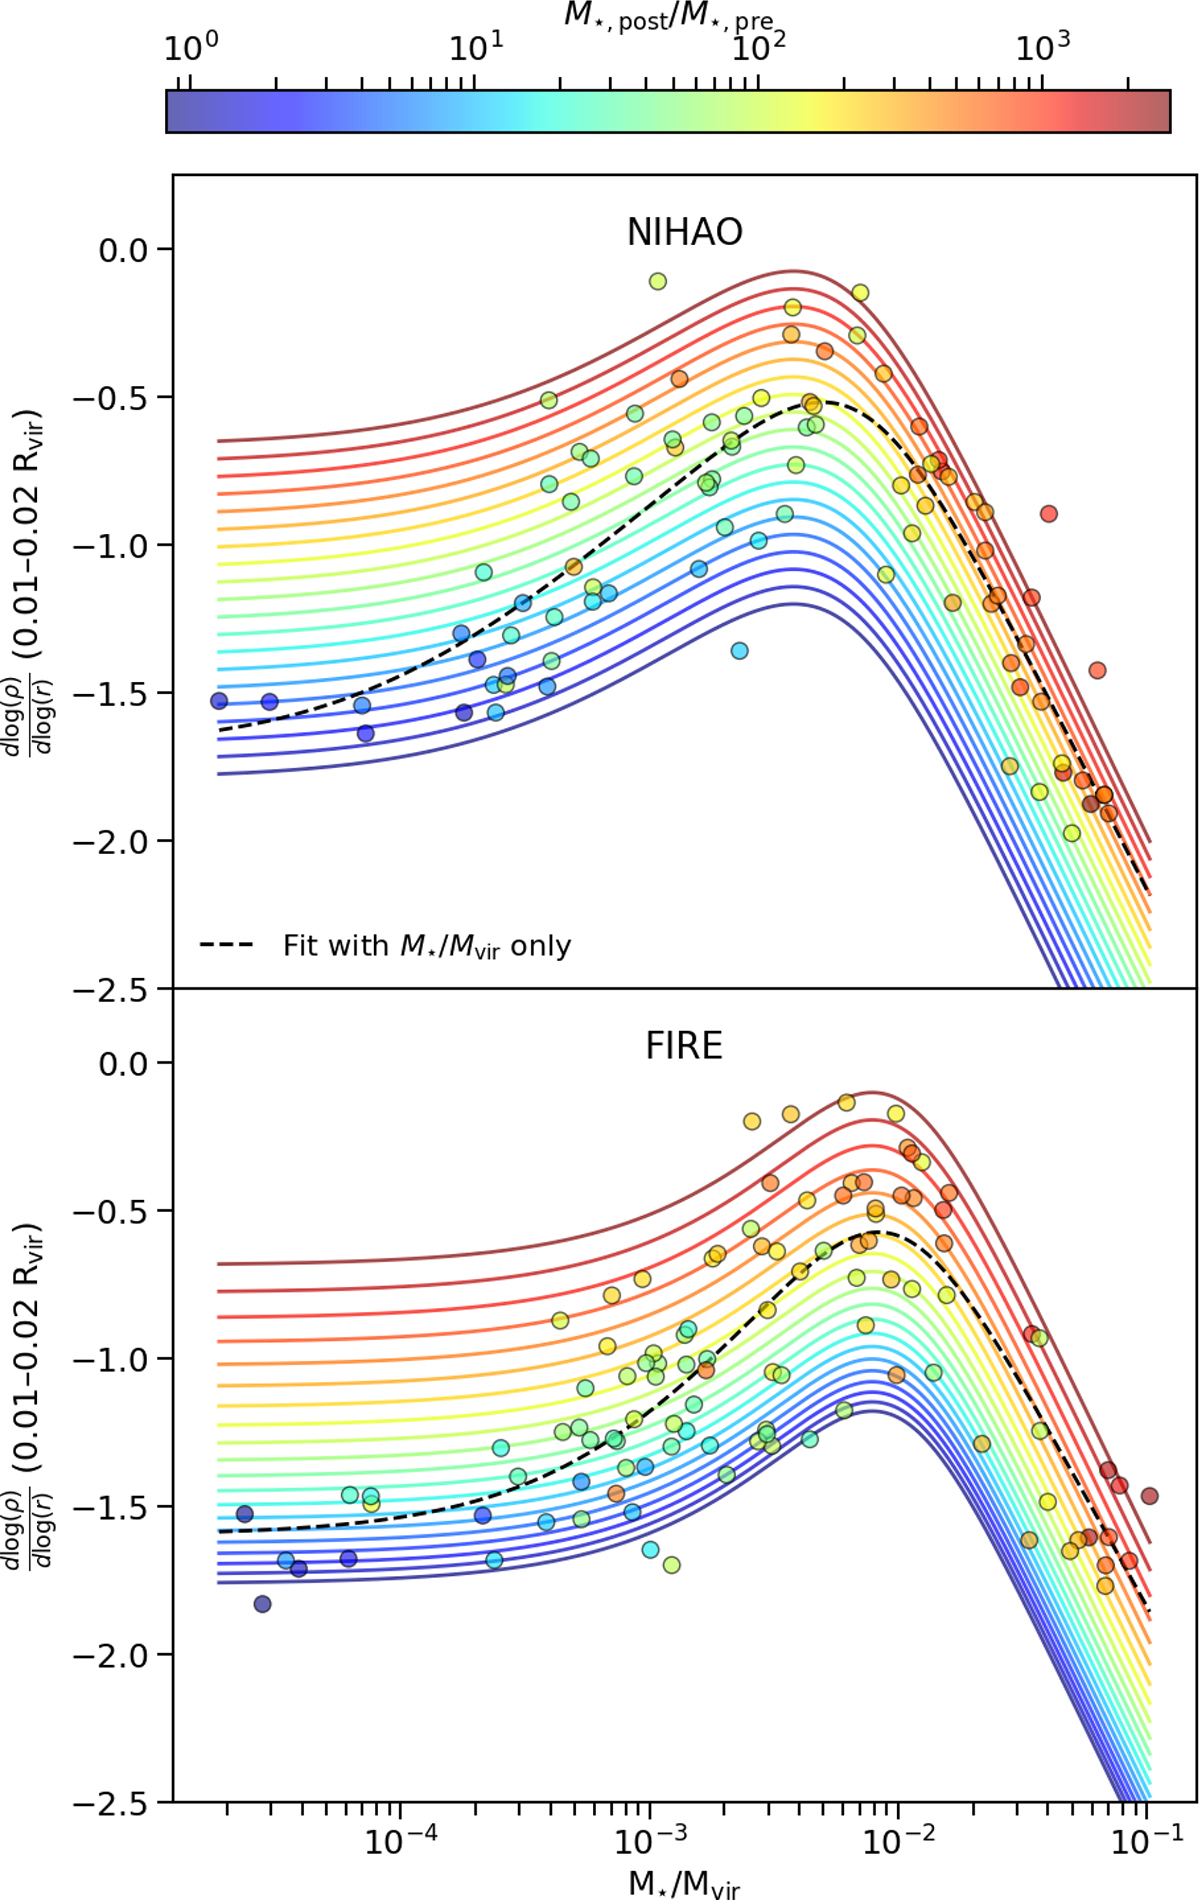
Download original image
True values (circles) and predictions (lines) for the inner slope of the dark matter density profile as a function of the stellar-to-halo mass ratio for different values of M★, post/M★, pre via the fit by Eq. (6) with the parameters shown in Table 4. Dashed black lines indicate fits using only the stellar-to-halo mass ratio, described by the parameters in Table 1 for Eq. (2). Top panel: Results for the NIHAO suite. Bottom panel: Same but for galaxies from the FIRE-2 dataset.
Current usage metrics show cumulative count of Article Views (full-text article views including HTML views, PDF and ePub downloads, according to the available data) and Abstracts Views on Vision4Press platform.
Data correspond to usage on the plateform after 2015. The current usage metrics is available 48-96 hours after online publication and is updated daily on week days.
Initial download of the metrics may take a while.