Fig. A.1.
Download original image
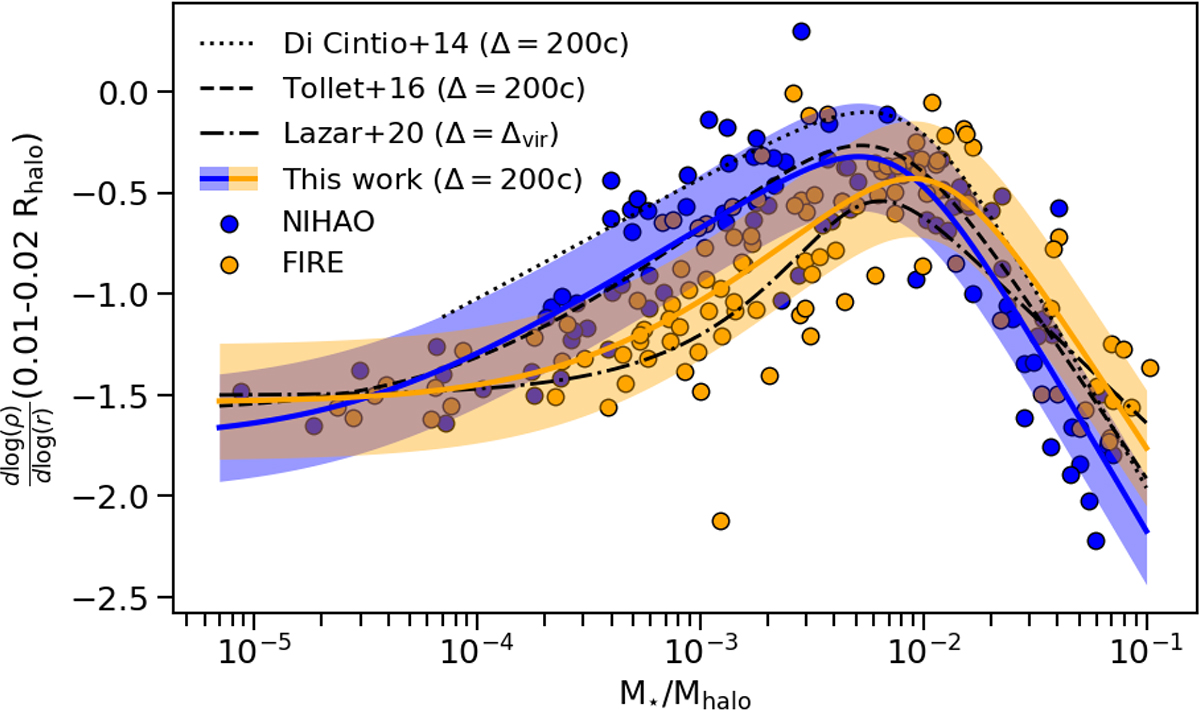
Inner slope of the dark matter density profile, measured between 1% and 2% of R200c, as a function of the stellar-to-halo mass ratio. Results are shown for galaxies from the NIHAO (blue) and FIRE-2 (orange) simulations. Solid lines represent fits following Eq. 2 and the 1σ scatter around the fits is indicated with shadowed regions. The trends are compared to literature fits from Di Cintio et al. (2014b), Tollet et al. (2016) and Lazar et al. (2020).
Current usage metrics show cumulative count of Article Views (full-text article views including HTML views, PDF and ePub downloads, according to the available data) and Abstracts Views on Vision4Press platform.
Data correspond to usage on the plateform after 2015. The current usage metrics is available 48-96 hours after online publication and is updated daily on week days.
Initial download of the metrics may take a while.