Fig. B.1.
Download original image
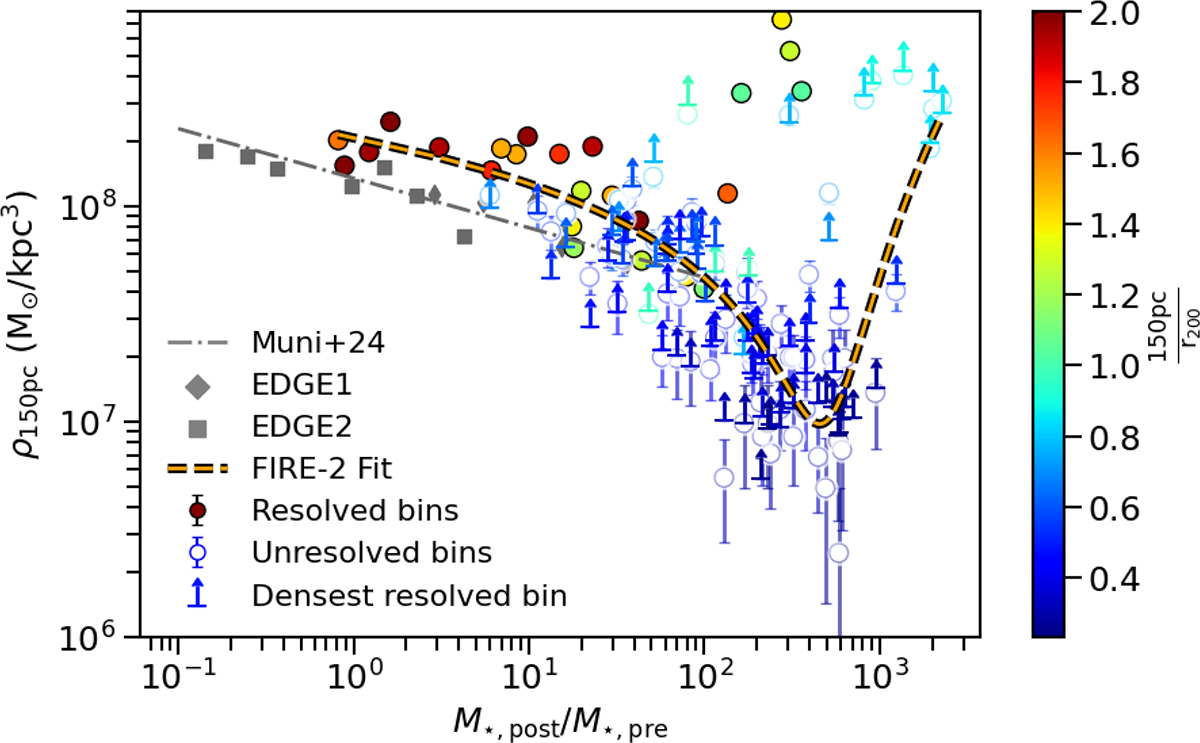
Dark matter density at 150 pc versus the ratio of stellar mass formed after and before re-ionisation. Grey symbols indicate Muni et al. (2024) results for EDGE galaxies, and the dash-dotted line shows their linear fit. Filled (empty) circles indicate the inner densities of FIRE-2 galaxies that are (un)resolved at 150 pc, with error bars representing Poisson uncertainties associated with the number of dark matter particles used to calculate the inner density. Markers are coloured based on the ratio between 150 pc and r200, a resolution limit marked by the radius enclosing 200 dark matter particles. For unresolved points, horizontal lines provide a lower limit to the inner density by taking the densest resolved bin in the density profile. The dashed orange line represents the fit to the inner densities, including unresolved bins.
Current usage metrics show cumulative count of Article Views (full-text article views including HTML views, PDF and ePub downloads, according to the available data) and Abstracts Views on Vision4Press platform.
Data correspond to usage on the plateform after 2015. The current usage metrics is available 48-96 hours after online publication and is updated daily on week days.
Initial download of the metrics may take a while.