Fig. 4
Download original image
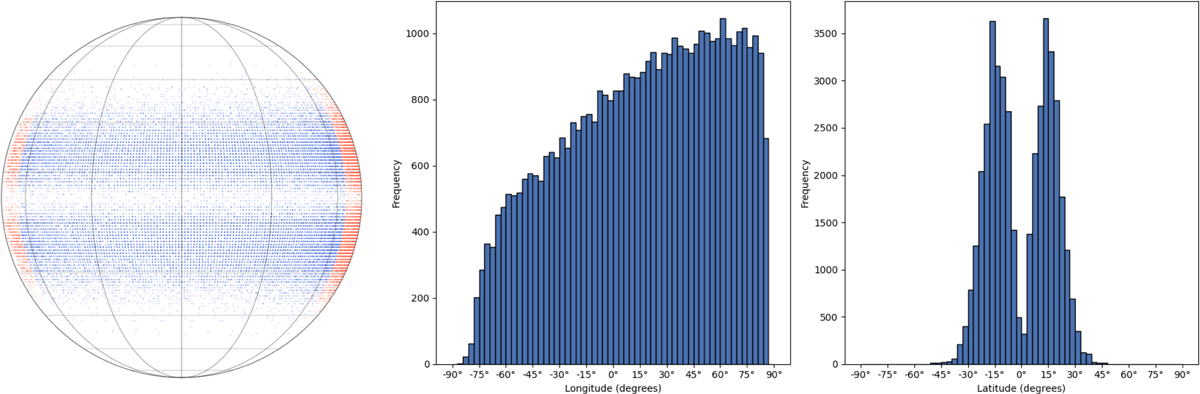
Spatial and heliographic distributions of AR cutouts in the ARCAFF:CCD dataset. Left: heliographic map showing the locations of all extracted AR cutouts. Cutouts with longitude greater than ±65° are highlighted in red (the quantisation of the positions arises from latitude and longitude being stored as integers in the SRS reports). Centre and right: histograms of the corresponding longitude and latitude distributions, respectively. Longitudes show the expected bias against detections near the limbs, while the latitude distribution reflects the activity belts of solar cycles.
Current usage metrics show cumulative count of Article Views (full-text article views including HTML views, PDF and ePub downloads, according to the available data) and Abstracts Views on Vision4Press platform.
Data correspond to usage on the plateform after 2015. The current usage metrics is available 48-96 hours after online publication and is updated daily on week days.
Initial download of the metrics may take a while.