Open Access
Fig. 10.
Download original image
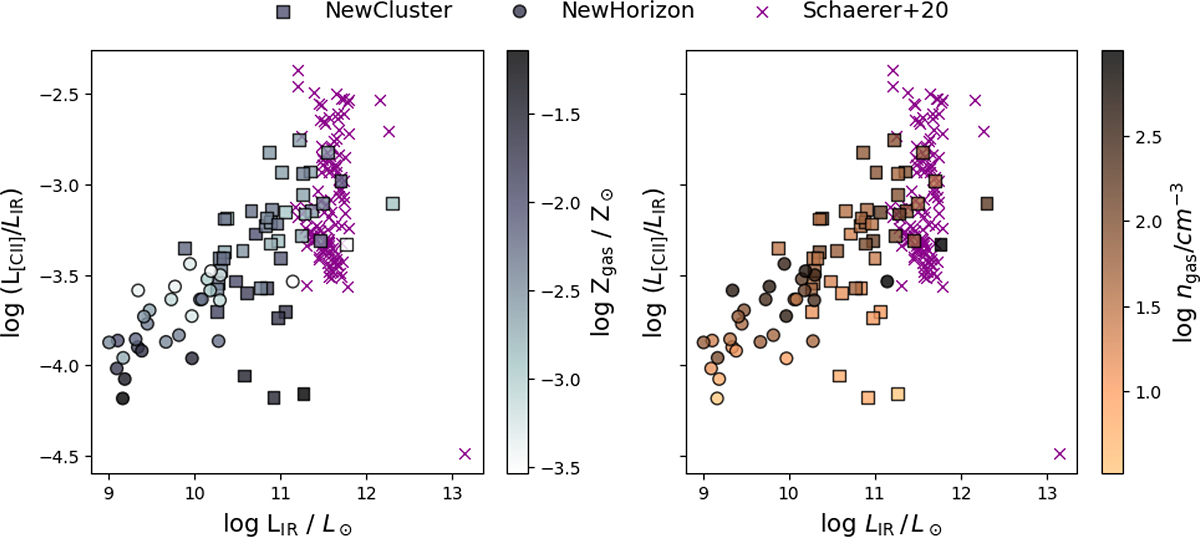
[C II]/IR luminosity ratios vs. IR luminosity of NEWCLUSTER (squares) and NEWHORIZON (circles). We color-code our sources based on the median gas metallicity (left) and median gas density (right) of each galaxy. We plot the observed ALPINE z ∼ 4 − 6 sources in purple (Schaerer et al. 2020) for comparison.
Current usage metrics show cumulative count of Article Views (full-text article views including HTML views, PDF and ePub downloads, according to the available data) and Abstracts Views on Vision4Press platform.
Data correspond to usage on the plateform after 2015. The current usage metrics is available 48-96 hours after online publication and is updated daily on week days.
Initial download of the metrics may take a while.