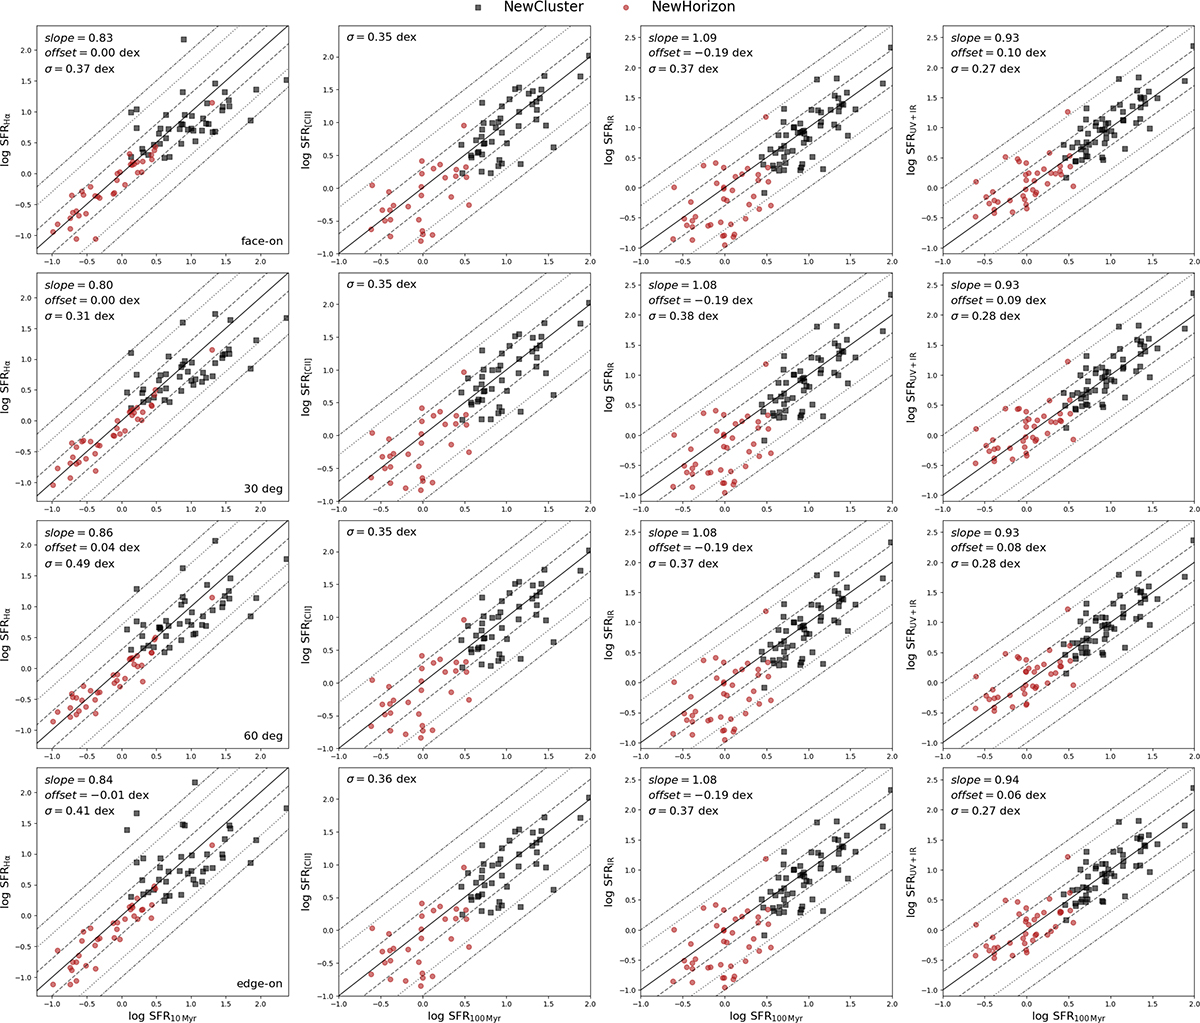
Fig. B.1.
Download original image
Left to right: SFR comparisons of Hα versus SFR10 Myr, [C II] at 158 μm versus SFR100 Myr, IR versus SFR 100Myr, and (UV + IR) versus SFR 100Myr for galaxies in the NEWCLUSTER (black squares) and NEWHORIZON (red circles) simulations. Each row corresponds to the different viewing angles: face-on, 30°, 60°, and edge-on (top to bottom). The solid gray line is the identity line, while the dashed, dotted and dash-dot lines indicate offsets of ±0.3, ±0.7, and ±1 dex, respectively. On the top left corner of each plot, the dispersion of the entire sample is shown.
Current usage metrics show cumulative count of Article Views (full-text article views including HTML views, PDF and ePub downloads, according to the available data) and Abstracts Views on Vision4Press platform.
Data correspond to usage on the plateform after 2015. The current usage metrics is available 48-96 hours after online publication and is updated daily on week days.
Initial download of the metrics may take a while.