Open Access
Fig. C.1.
Download original image
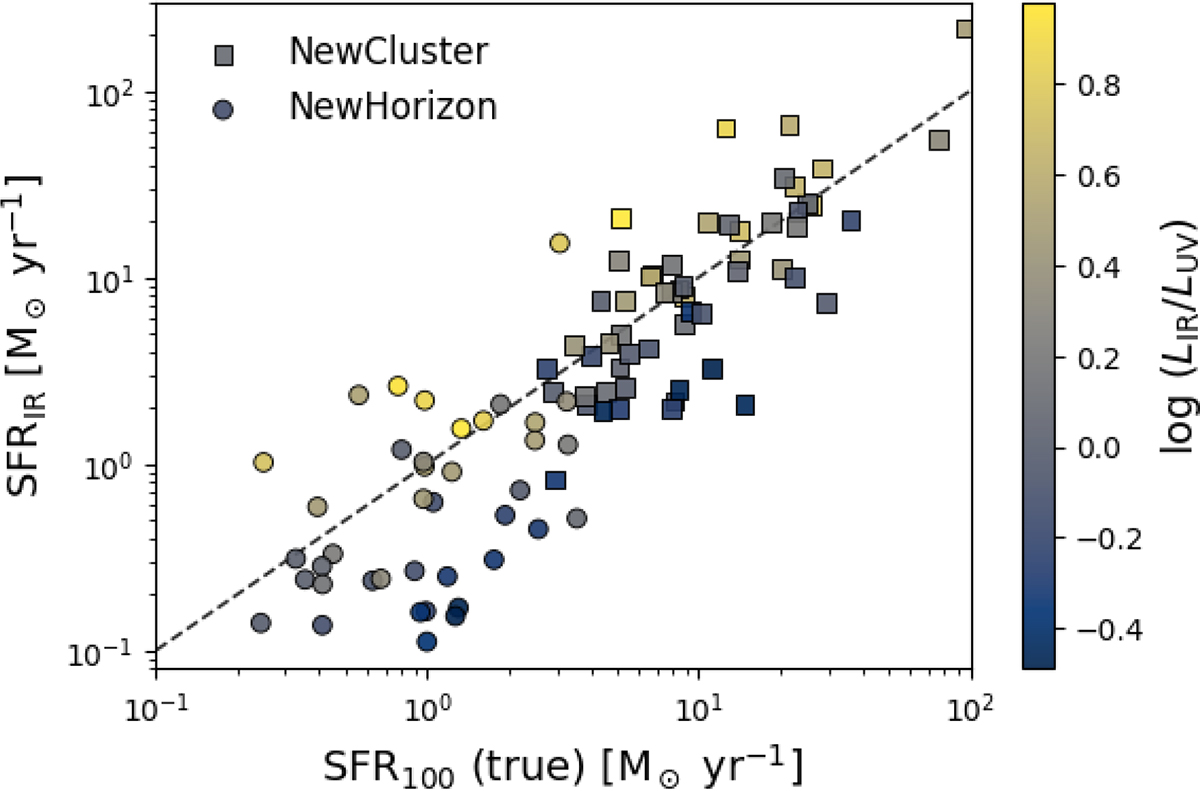
IR inferred SFRs versus time-averaged SFR over 100 Myr for NEWCLUSTER (squares) and NEWHORIZON (circles) simulated galaxies. We color code the data points based on the ratio of the total IR (8 − 1000 μm) and far-UV (1500 Å) luminosity (see Sect. 4.2 for details).
Current usage metrics show cumulative count of Article Views (full-text article views including HTML views, PDF and ePub downloads, according to the available data) and Abstracts Views on Vision4Press platform.
Data correspond to usage on the plateform after 2015. The current usage metrics is available 48-96 hours after online publication and is updated daily on week days.
Initial download of the metrics may take a while.