Fig. 9.
Download original image
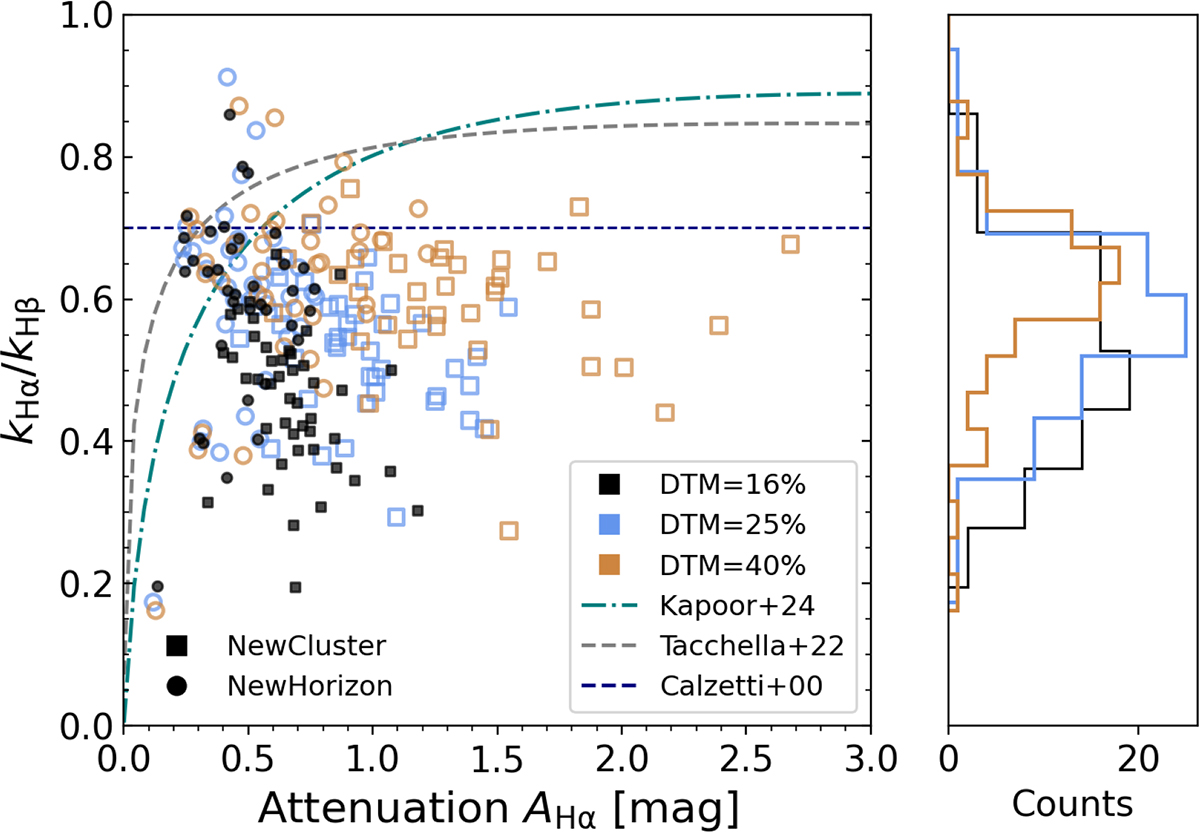
Left: Ratio of the Hα and Hβ attenuation laws derived vs. the Hα attenuation for NEWHORIZON (circles) and NEWCLUSTER (squares) simulated galaxies. Black, blue, and orange represent DTM ratios of 16%, 25%, and 40%, respectively. The ratio derived for simulated galaxies from Tacchella et al. (2022) (dashed gray line) and Kapoor et al. (2024) (dash-dotted teal line) and that derived by Calzetti et al. (2000) (dashed blue line) for local starbursts are shown. Right: Distribution of the derived attenuation law ratios for our sources at different DTM ratios.
Current usage metrics show cumulative count of Article Views (full-text article views including HTML views, PDF and ePub downloads, according to the available data) and Abstracts Views on Vision4Press platform.
Data correspond to usage on the plateform after 2015. The current usage metrics is available 48-96 hours after online publication and is updated daily on week days.
Initial download of the metrics may take a while.