Fig. 1.
Download original image
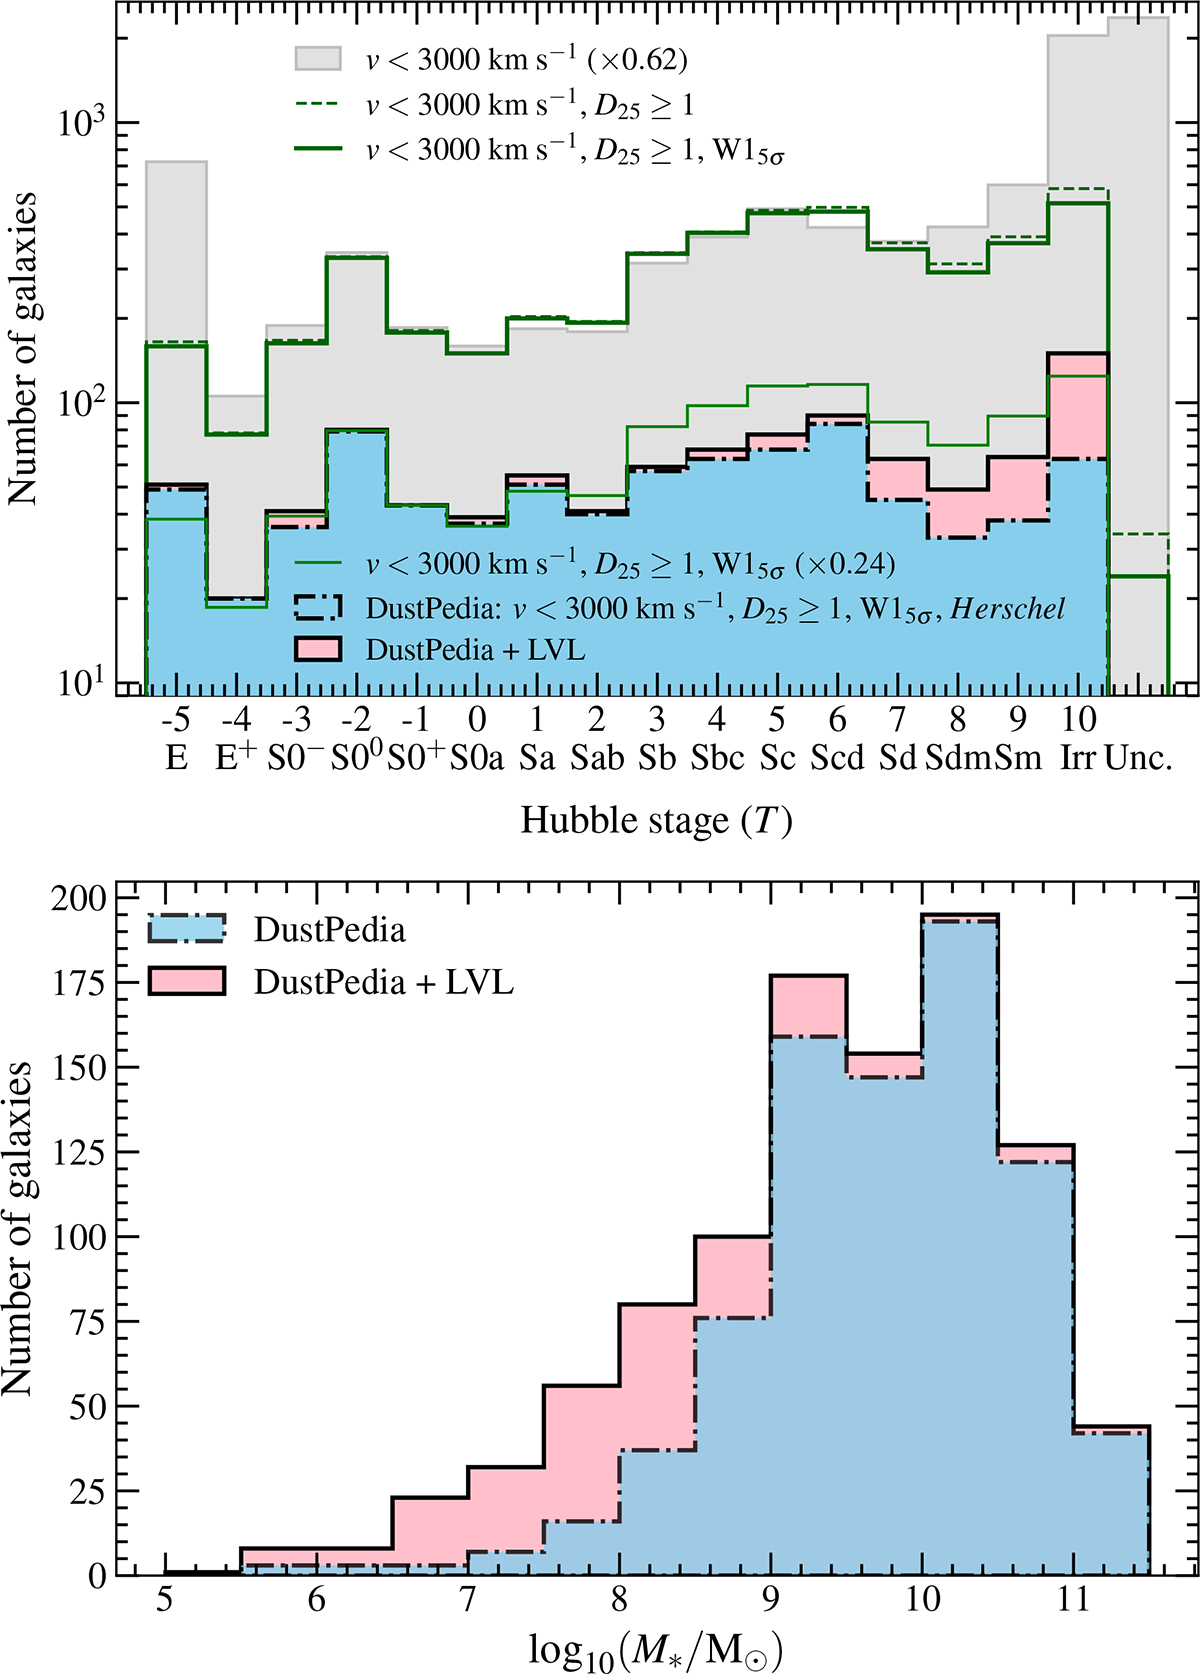
Distributions of the morphological type (top panel) and stellar mass (bottom panel) of the galaxies in our study. Blue histograms represent the distributions of DustPedia galaxies, while the pink ones correspond to the DustPedia + LVL combined sample. In the top panel the HyperLEDA parent sample, from which DustPedia was selected, is plotted with a grey histogram. Changes in the distribution, due to further selection criteria (i.e. D25 > 1′ and W1-band above 5σ) are shown with a dashed and a solid green histogram, respectively. An extra bin includes morphologically unclassified (Unc.) sources.
Current usage metrics show cumulative count of Article Views (full-text article views including HTML views, PDF and ePub downloads, according to the available data) and Abstracts Views on Vision4Press platform.
Data correspond to usage on the plateform after 2015. The current usage metrics is available 48-96 hours after online publication and is updated daily on week days.
Initial download of the metrics may take a while.