Fig. 2.
Download original image
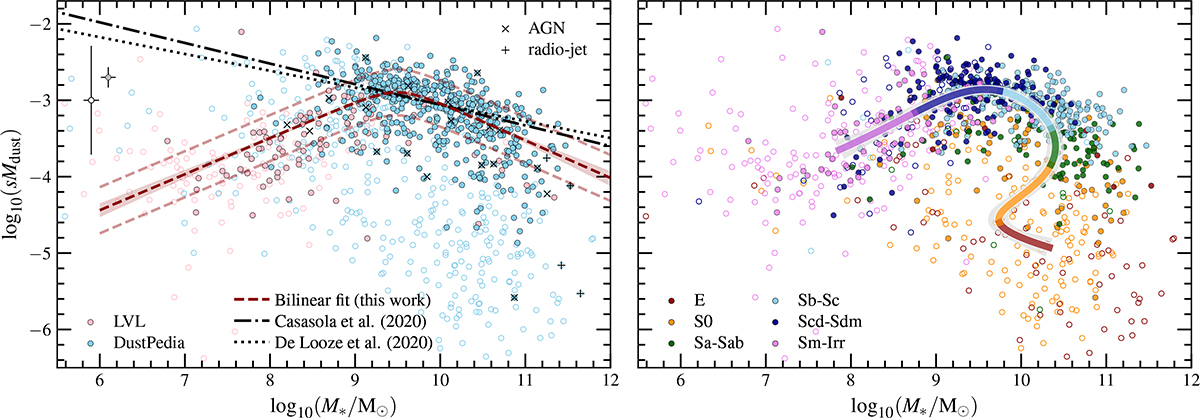
sMdust as a function of M*. In the left panel DustPedia and LVL galaxies are shown in blue and pink, respectively; in the right panel galaxies are colour-coded with morphology. Objects are divided between those with larger (open and paler circles) and smaller uncertainties (filled and darker circles; see text for details): the black error bars in the left panel show the median values of the uncertainties in both ranges. In the left panel, the dashed red curve is the smoothly joined bilinear fit for LTGs, the shaded area shows the dispersion around the fit, and the two paler dashed curves indicate the fitted intrinsic scatter. We also show the fits by Casasola et al. (2020) and De Looze et al. (2020), and mark galaxies hosting AGNs or s radio jet with a ‘x’ or a ‘+’ symbol, respectively (see Sect. 3). In the right panel, the coloured curve shows the combination of the fitted fifth-order polynomials, of each physical property, parametrised with Hubble stage (from T = −5 to T = 10; pink to dark-red; see Table B.1) on the sMdust–M* plane. The uncertainty of the polynomials is indicated by the shaded grey area.
Current usage metrics show cumulative count of Article Views (full-text article views including HTML views, PDF and ePub downloads, according to the available data) and Abstracts Views on Vision4Press platform.
Data correspond to usage on the plateform after 2015. The current usage metrics is available 48-96 hours after online publication and is updated daily on week days.
Initial download of the metrics may take a while.