Fig. A.2.
Download original image
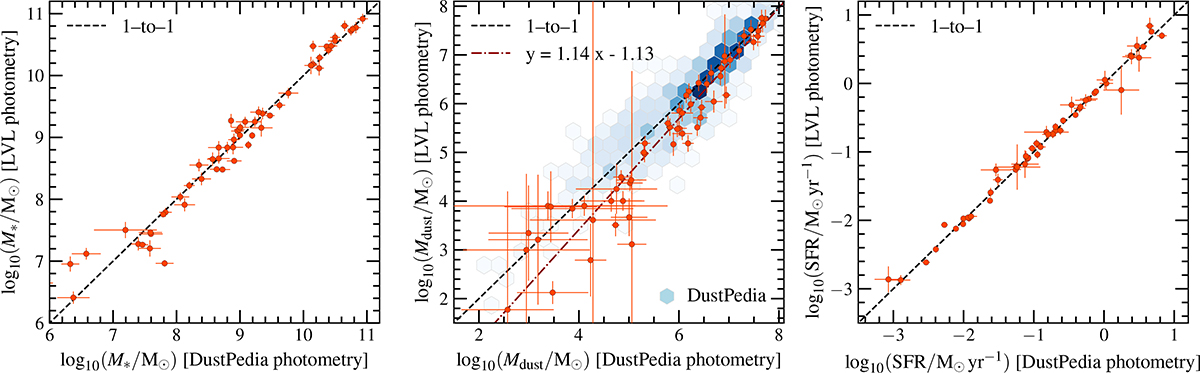
Comparison between the physical properties of galaxies in common between the DustPedia and LVL samples, derived from DustPedia photometry (x axis) and LVL photometry (y axis) and using the CIGALE parameter space adopted in this work. Stellar mass, dust mass and SFR are shown in the left, middle and right panel, respectively. A solid black line indicates the one-to-one relation. For both datasets we used the DustPedia distances (Clark et al. 2018). In the middle panel, the linear fit to the data is shown with a dark-red dashed line. Also, a density plot indicates the corresponding correlation for all DustPedia galaxies, where in the y axis we use the dust masses derived by restricting the photometry to the wavelength range of LVL (i.e. up to 160 μm), while in the x axis we use the results derived from the full DustPedia wavelength coverage.
Current usage metrics show cumulative count of Article Views (full-text article views including HTML views, PDF and ePub downloads, according to the available data) and Abstracts Views on Vision4Press platform.
Data correspond to usage on the plateform after 2015. The current usage metrics is available 48-96 hours after online publication and is updated daily on week days.
Initial download of the metrics may take a while.