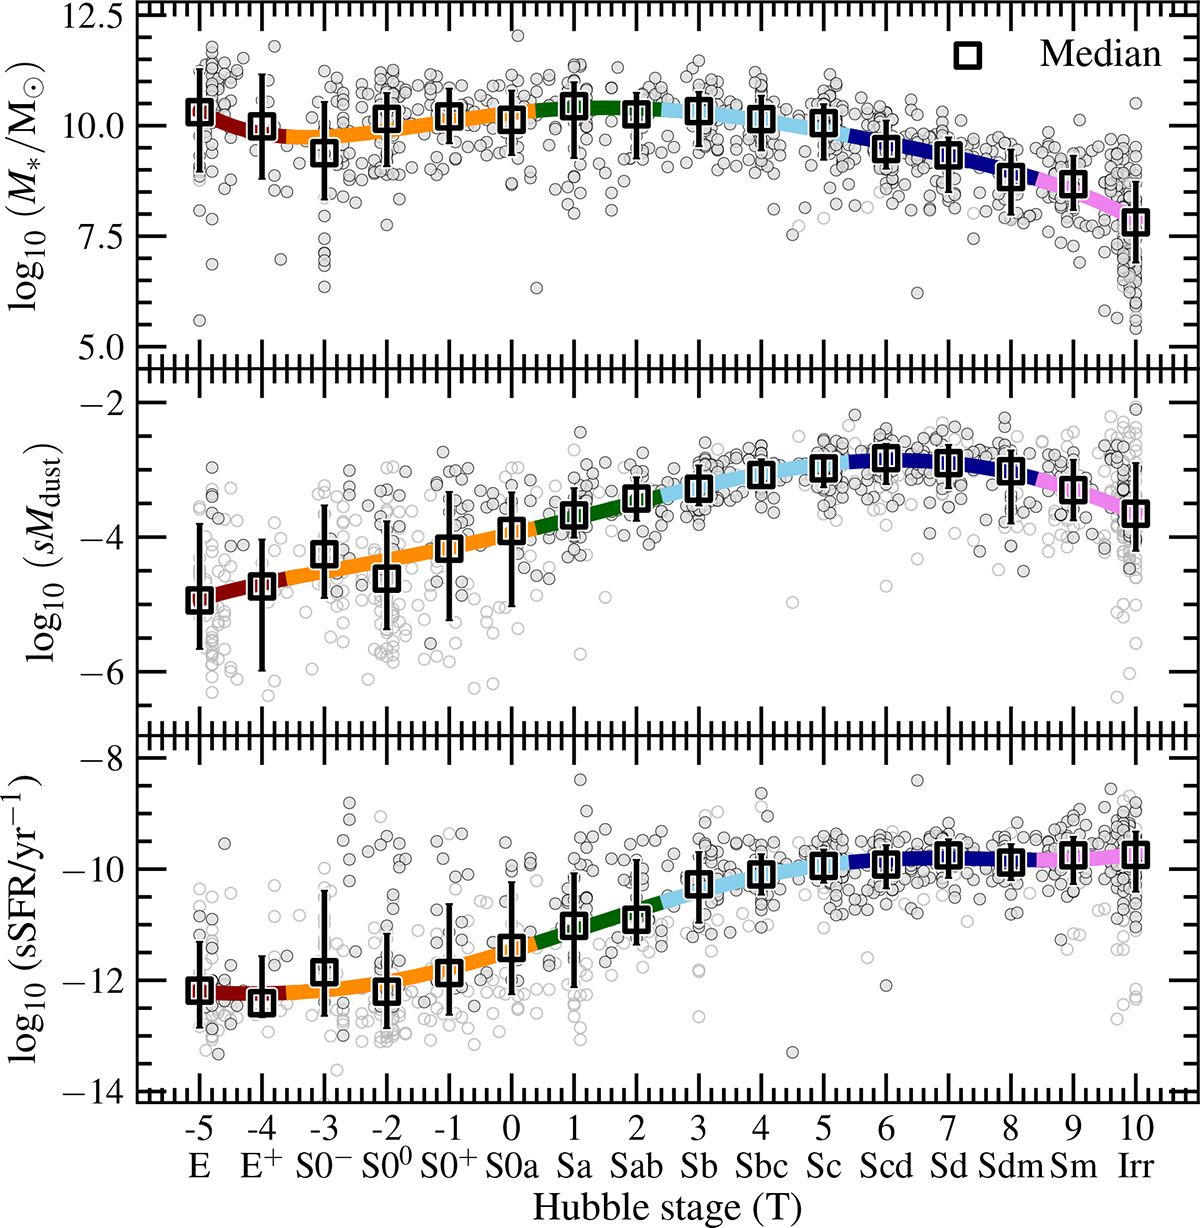
Fig. B.1.
Download original image
Variation in M*, sMdust, and sSFR as a function of Hubble stage, from top to bottom panel, respectively. In each panel grey circles correspond to individual galaxies, black squares are the median values for each morphological bin. Error bars bracket the range between the 16th and 84th percentiles from the median. The curves, colour-coded with morphology (such as the data points in Figs. 2 and 3), are the fifth-order polynomial regressions to the median values (see Table B.1 for the polynomial regression parameters).
Current usage metrics show cumulative count of Article Views (full-text article views including HTML views, PDF and ePub downloads, according to the available data) and Abstracts Views on Vision4Press platform.
Data correspond to usage on the plateform after 2015. The current usage metrics is available 48-96 hours after online publication and is updated daily on week days.
Initial download of the metrics may take a while.