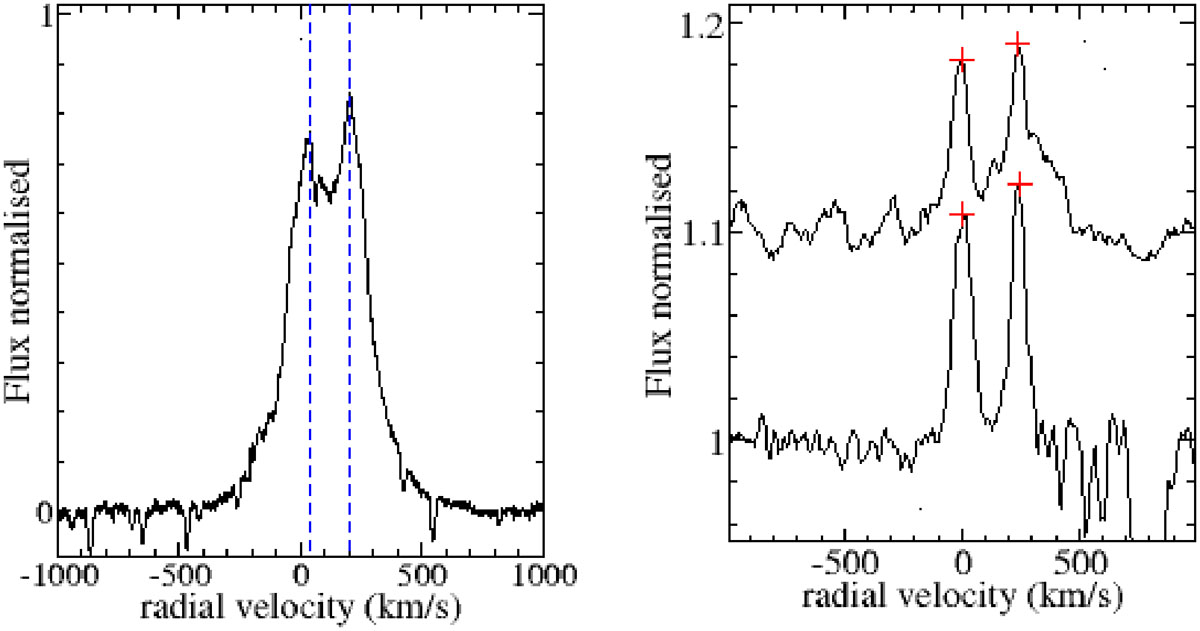
Fig. 4.
Download original image
Emission lines seen in the spectrum of LS 437 taken on 2022 March 27 in velocity space. The left panel shows Hα, the strongest emission line in the spectrum, with the two lines marking the position of the peaks. The right panel shows two He I lines, λ5015 (top) and λ5875 (bottom), with crosses marking the position of the peaks. The Fe IIλ5018 line is blended into the red wing of λ5015.
Current usage metrics show cumulative count of Article Views (full-text article views including HTML views, PDF and ePub downloads, according to the available data) and Abstracts Views on Vision4Press platform.
Data correspond to usage on the plateform after 2015. The current usage metrics is available 48-96 hours after online publication and is updated daily on week days.
Initial download of the metrics may take a while.