| Issue |
A&A
Volume 710, June 2026
|
|
|---|---|---|
| Article Number | A76 | |
| Number of page(s) | 13 | |
| Section | Stellar structure and evolution | |
| DOI | https://doi.org/10.1051/0004-6361/202659001 | |
| Published online | 03 June 2026 | |
Astrophysical parameters of LS 437 and the nature of X0726–260
1
Departamento de Física, Facultad de Ciencias, Universidad de Alicante, Carretera de San Vicente s/n, E03690 San Vicente del Raspeig, Spain
2
Instituto Universitario de Investigación Informática, Universidad de Alicante, San Vicente del Raspeig, Spain
3
Instituto de Astrofísica de Canarias, E-38200 La Laguna, Tenerife, Spain
4
Universidad de La Laguna, Dpto. Astrofísica, E-38206 La Laguna, Tenerife, Spain
5
South African Astronomical Observatory, Observatory Road, Observatory, 7925 Cape Town, South Africa
6
Southern African Large Telescope, Observatory Road, Observatory, 7925 Cape Town, South Africa
7
DFISTS, EPS, Universidad de Alicante, Carretera San Vicente del Raspeig s/n, E-03690 San Vicente del Raspeig, Spain
★ Corresponding author: This email address is being protected from spambots. You need JavaScript enabled to view it.
Received:
16
January
2026
Accepted:
12
April
2026
Abstract
Context. Be/X-ray binaries, the most common class of high-mass X-ray binaries, are characterised by OBe companions, but they display a rich variety of X-ray behaviours. One of the most atypical systems is X0726−260, which also has the earliest optical counterpart among the whole Milky Way and Magellanic Cloud sample.
Aims. We intend to improve the characterisation of its optical counterpart, LS 437, and to constrain the physical mechanisms responsible for the anomalous properties of X0726−260.
Methods. We analysed high-quality high-resolution optical spectroscopy of LS 437 with the standard quantitative methodology to derive the stellar parameters. We also made use of archival X-ray monitoring.
Results. We derived a moderate projected rotational velocity of v sin i ≈ 155 km s−1 and a spectral type O7.5 Ve (Teff = 36 000 K), which means that LS 437 is substantially earlier than any other Oe star in an X-ray binary. At this spectral type, the stellar wind likely contributes significantly to mass accretion, and the X-ray light curve is strongly suggestive of an orbitally modulated wind accretor. The source shows marked carbon depletion, whereas nitrogen is only slightly above solar abundance.
Conclusions. LS 437 is one of the earliest Oe stars known in the Galaxy, alongside HD 155806. Long-term X-ray light curves of X0726−260 strengthen the identification of a persistent 34.5 d periodicity as the orbital period, demonstrating that the X-ray emission is orbitally modulated, and no X-ray outbursts have occurred over the past 30 years. Likewise, emission features in the optical spectrum indicate a remarkably stable circumstellar disk, with no sign of major structural changes over the past 40 years. All of these characteristics clearly set X0726−260 apart from typical Be/X-ray binaries.
Key words: binaries: close / stars: emission-line / Be / stars: neutron / stars: individual: LS 437 / pulsars: individual: 4U 0728–25 / X-rays: stars
© The Authors 2026
 Open Access article, published by EDP Sciences, under the terms of the Creative Commons Attribution License (https://creativecommons.org/licenses/by/4.0), which permits unrestricted use, distribution, and reproduction in any medium, provided the original work is properly cited.
This article is published in open access under the Subscribe to Open model. This email address is being protected from spambots. You need JavaScript enabled to view it. to support open access publication.
1. Introduction
Be/X-ray binaries (from now on, BeX) constitute a major class of high-mass X-ray binaries (HMXBs) characterised by a Be star as the optical counterpart (see Reig 2011, for a review). A Be star is an early-type star that has, at some stage, displayed emission lines. Most Be stars (classical Be stars) are fast rotators surrounded by a quasi-Keplerian circumstellar disk (see Porter & Rivinius 2003, for a review). Be stars are not far from the main sequence and generally have luminosity classes from III to V (see Negueruela 2004). In the Milky Way, they span spectral types extending from late O (O9, technically Oe) to early A (A shell stars may be a continuation at lower temperatures; see Abt et al. 1997). The fraction of Be stars is higher among early B-types (peaking at B1–B2; Zorec & Briot 1997; Tarasov & Malchenko 2012), although it may also be high around B7 (Mathew et al. 2008, but see also McSwain & Gies 2005).
Most BeX exhibit characteristics that cause their mass donors to be identified as classical Be stars, such as double-peaked emission lines and near-infrared excesses (e.g. Riquelme et al. 2012). An exception is the persistent X-ray source 4U 2206+54, whose counterpart, the peculiar O-type star BD +53°2790, displays emission lines but also characteristics atypical of a classical Be star (Negueruela & Reig 2001; Blay et al. 2006). The vast majority of BeX, when observed with sufficiently sensitive instruments, present X-ray pulsations, which together with power-law X-ray spectra, identify their mass accretors as magnetised neutron stars (e.g. Boldin et al. 2013; Klus et al. 2014; Yang et al. 2017).
Broadly speaking, BeX can be divided into two groups according to their long-term X-ray behaviour:
-
Transient BeX spend most of their time in quiescence, emitting X-rays below the detection threshold of survey instruments (see Tsygankov et al. 2017b). Occasionally, they undergo a series of outbursts at moderate luminosities, LX ∼ 1036 erg s−1, generally recurring with their orbital period (Type I outbursts) or giant (LX ≳ 1037 erg s−1) outbursts of longer duration (Type II outbursts). These systems tend to have measurable eccentricities (e ≳ 0.3) and orbital periods ranging from tens to a few hundred days. Their behaviour can be explained by the truncated disk model of Okazaki & Negueruela (2001). There is also a small group of BeX transients with very low eccentricity (e.g. XTE J1543−568 or KS 1947+300; Townsend et al. 2011; Fortin et al. 2023).
-
Persistent BeX show much less X-ray variability. They present moderately variable low luminosity (LX ≲ 1035 erg s−1), long (≳200 s) pulsation periods, and a lack of a 6.4 keV Fe line in their spectra (Reig & Roche 1999). La Palombara et al. (2025b) redefined the class by adding the presence of a hot blackbody component in their X-ray spectrum to their typical characteristics and relaxing the need for long spin periods. This allowed them to extend the class to objects with shorter spin periods. Nevertheless, the separation between the two groups has been somewhat diluted by the transition of the prototype of the class RX J0440.9+4431 to an outbursting phase (e.g. Li et al. 2024).
With regard to their optical counterparts, all Galactic BeX with reliable spectral classifications are earlier than B2, with most presenting spectral types in a very narrow range around B0 (Reig 2011). A correlation has been seen between the maximum historical value of the equivalent width (EW) of the Hα emission line and the orbital period of the BeX, and it has been interpreted in terms of circumstellar disk truncation since the EW of Hα is taken as a proxy for disk size at a given time (Reig et al. 1997; Reig 2011). The correlation is loose because other factors such as inclination to the line of sight also affect the EW (see Reig et al. 2016, for a careful discussion of disk variability in BeX). A similarly loose correlation also exists between the spin and orbital periods of BeX systems. This correlation, first noted by Corbet (1986), may arise from a balance between neutron star spin-up during accretion and spin-down during quiescence, but the exact mechanism is obscured by the complexity of the physical problem (see Cheng et al. 2014; Xu & Li 2019, and references therein).
In this context, the peculiar Be/X-ray binary X0726−260 (=4U 0728−25) does not seem to fit any of the known classes. Discovered in the early days of X-ray astronomy, X0726−260 has been consistently detected at X-ray luminosities ranging from LX ≈ 1035 erg s−1 to roughly six times brighter (La Palombara et al. 2025a, and references therein), with some indication of fluxes being consistently brighter during its first decade of observations. Its optical counterpart, LS 437 (=V441 Pup), was identified as a late O-type emission-line star at a relatively high distance of ∼6 kpc (Negueruela et al. 1996). Spectral classification of Oe stars is difficult, as some diagnostic He I lines may present emission components (Negueruela et al. 2004). Two approaches are possible. When insisting on the morphological character of classification, the presence of emission components is not considered, and the ratios between the composite He I lines and He II lines are used as in any other O-type star. With these criteria, Maíz Apellániz et al. (2016) classified LS 437 as O5: Ve. A second method to classify Oe stars is by guessing the intrinsic shape of the absorption He I lines and providing a corrected line ratio that more closely informs one about the star’s physical parameters. Following this approach, Negueruela et al. (1996) classified LS 437 as O8−9 Ve.
The unseen companion to LS 437 is without any doubt a neutron star. Using RossiXTE observations, Corbet & Peele (1997) found a pulsation period of 103 s and a strong X-ray flux modulation with a 34.5 d periodicity, confirmed by subsequent observations with other satellites (also see Section 3.6), which they interpreted as the orbital period. A 2016 observation with AstroSAT found strong pulsations at 103.144 s (Roy et al. 2020), while a more recent measurement with XMM-Newton found Pspin = 103.301 s (La Palombara et al. 2025a), indicating significant spin down. Its spectrum can be fitted with the typical power-law plus soft blackbody model observed in many accreting neutron stars, though alternative models provide equally acceptable fits (La Palombara et al. 2025a).
In this paper, we present a collection of intermediate to high resolution optical spectra of the counterpart, LS 437, with the aim of deriving its stellar parameters. In combination with lower-resolution optical spectroscopy and long-term X-ray monitoring, these data allowed us to constrain the nature of this peculiar system.
2. Observations
2.1. Optical spectroscopy
Several spectra of low or intermediate-low (R ≲ 2500) resolution were taken between 1999 and 2006 during observing campaigns at a number of telescopes. Details are presented in Table 1. These observations complement the more intensive monitoring presented in Negueruela et al. (1996) for the 1990−1995 interval.
Summary of low-resolution spectra of LS 437.
All spectroscopic data from these campaigns were reduced using the STARLINK1 software suite (Currie et al. 2014), including ccdpack2, figaro (Shortridge et al. 2014), and dipso (Howarth et al. 2014). This historical dataset is highly heterogeneous, comprising diverse instrumental configurations and resolutions.
Additionally, a number of high-intermediate (R > 5000) resolution spectra of LS 437 have been taken throughout the years and were used for spectroscopic analysis. The earliest spectrum was taken with the ESO Multi-Mode Instrument (EMMI) on the New Technology Telescope at La Silla Observatory (Chile) on the night of 2006 February 16. A general description of the observing run is given in Marco & Negueruela (2009). The red arm of the instrument was used in echelle mode. The detector consisted of a mosaic formed by two thin back-illuminated and AR-coated 2048 × 4096 MIT/LL CCDs with 15 μm × 15 μm pixels, mounted side-by-side, with a 47-pixel overscan gap in between (in the x direction). We used the echelle grating #9 cross-dispersed with grism #3 on the red arm. This configuration provides R ≈ 10 000 over the 4000−7900 Å range, with a small gap around 4950 Å.
Due to the low efficiency of the red arm in the blue part of the spectrum, we complemented these observations with grating #3 in the blue arm. The detector in the blue arm was a 1024 × 1024 Textronik CCD with 24 μm × 24 μm pixels. This configuration gave R = 3400 over the 3925−4380 Å range. We also used this grating with a redder central wavelength to obtain a spectrum covering 4380−4800 Å. The concatenation of these two spectra is shown in Fig. 1.
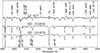 |
Fig. 1. Classification spectrum of LS 437 together with two reference stars, the mild Be HD 155806 (O7.5 Ve) and the moderate rotator HD 124979 (O7.5 IV). Spectral lines of special interest are marked in larger font. See the main text for a detailed description. |
We obtained several optical spectra with the Southern African Large Telescope (SALT) starting in October 2020, using the High Resolution Spectrograph (HRS) in either medium or low resolution modes. Among these data, we selected the spectrum taken in low-resolution mode on 2022 March 27, which has the highest signal-to-noise (S/N) ratio in the whole dataset. This spectrum has a resolving power of R ≈ 16 000 and was reduced using the telescope primary reduction pipeline and the MIDAS package of Kniazev et al. (2016). The blue arm covers the range 3750−5400 Å, although the spectrum is only useful from ≈4000 Å, due to a very low S/N and poor order tracing. The red arm covers the range from 5450 Å to 8790 Å, although the S/N is low shortwards of ≈5600 Å.
Finally, we observed LS 437 with the Gran Telescopio Canarias (GTC), using the integral fibre unit (IFU) mode of the Multi-Espectrógrafo en GTC de Alta Resolución para Astronomía (MEGARA) spectrograph. The IFU mode covers a field of view of 2.5 × 11.3 arcsec, complemented by eight additional seven-fiber minibundles placed on the outer part of the field of view for sky subtraction. We obtained several spectra in the mid-resolution configuration of MEGARA using four different volume phase holographic gratings. On the night 2019 December 4, two spectra were taken using the MR-R and MR-U setups. These configurations gave R = 12 000 over the 6243−6865 Å and 3920−4282 Å ranges, respectively. On the nights of 2020 February 8 and 9, we obtained two spectra using the MR-UB setup and two others using the MR-B setup. These configurations provided a similar spectral power (R = 12 000) over the 4226−4625 Å and 4585−5025 Å ranges, respectively. The spectra were reduced using the MEGARA data reduction pipeline (see Cardiel & Pascual 2018; Pascual et al. 2018, 2019) and combined into a single spectrum for analysis.
2.2. X-ray data
We downloaded long-term light curves from the archives of all missions that have provided long-term X-ray monitoring. The oldest dataset is that of RossiRXTE (2−12 keV), which covers the MJD range from 50 087 to 55 926. A similar energy range (2−20 keV) is provided by MAXI for the MJD range between 55 066 and 59 997, thus providing some overlap. The Neil Gehrels Swift observatory monitors a harder energy band (15−50 keV). The observations analysed here span the MJD range from 53 416 to 59 996.
3. Analysis
3.1. Spectrum description
The broadband optical spectrum of LS 437 is dominated by moderately strong emission lines of H I and He I. Weaker emission features of Fe II and other metals are visible in the yellow and red (≈5000 to 7500 Å) regions observed in the EMMI echelle and SALT/HRS spectra. An example is shown in Fig. 2. The only prominent photospheric lines correspond to He II, clearly identifying the source as an O-type star.
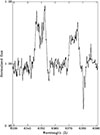 |
Fig. 2. Detail of the SALT/HRS spectrum displaying the region comprising the Si II 6347 Å and Fe II 6371 Å emission lines. |
The classification spectrum of LS 437 observed with EMMI is displayed in Fig. 1 together with two suitable comparison stars. HD 155806 is the only Be star catalogued to be earlier than O8 in the Milky Way. Its Be characteristics are weak (see Negueruela et al. 2004), and here they are mostly manifested through the emission wings in He I 4713 Å and the asymmetry of Hγ, due to a weak emission component. In contrast, LS 437 presents Hγ almost completely filled in and a double peak rising above the continuum. HD 124979 was classified as O7.5 IV(n)((f)) by Sota et al. (2014). Its rotational velocity has recently been estimated at ≈260 km s−1 (Holgado et al. 2022), and thus its spectrum provides a closer match to LS 437 since HD 155806 shows narrow lines. Its projected rotational velocity is around ≈50 km s−1 (Simón-Díaz et al. 2017), and thus the line profiles are dominated by instrumental broadening in the R ≈ 5000 spectrum shown in Fig. 1, taken from Negueruela et al. (2004).
One obvious difference between LS 437 and the comparison stars is the weakness of He I 4471 Å, due to emission infilling. Emission in He I lines such as λ6678 or λ5875 is common in early Be stars, but He I 4471 Å remains purely photospheric even in some O9e stars (Negueruela et al. 2004). It is seen in emission in the Oe star HD 39680 (Negueruela et al. 2004) and in several Oe stars recently discovered in the Small Magellanic Cloud (Golden-Marx et al. 2016), most likely reflecting a higher temperature of the decretion disk when compared to Be stars. Since the ratio He I 4471 Å/He II 4541 Å serves as the primary criterion for spectral classification of O-type stars, a fully meaningful spectral type cannot be given for these Oe stars, as discussed in the introduction.
Another indication of a high disk temperature is the presence of Mg II 4481 Å in emission. To our knowledge, this emission feature has not been reported in any other Oe star, although it is very likely filled in in the spectrum of HD 39680 presented by Negueruela et al. (2004) and is strong in more recent spectra of this object present in the IACOB database (Simón-Díaz et al. 2011, 2015). Both HD 155806 and HD 39680 display double-peaked emission in C II 4267 Å, another line not seen in Be stars. A very weak double-peaked emission feature may be assumed in the spectrum of LS 437, but its presence is doubtful. As seen in Fig. 2, the Si II 6437 Å line is strongly in emission. Some of the lower resolution spectra strongly suggest that the Si II 4129 Å doublet may also be weakly in emission, although this is not obvious in the high-resolution spectra because of the complexity of the spectral region and because this Si II feature is a doublet. We note that photospheric absorption is not expected for either Si II or C II at these early types (Sota et al. 2014).
The most striking difference between LS 437 and the comparison stars is the weakness of its C III lines. Both λ4072 and λ4650 are much weaker than in normal mid- or late-O stars, while λ4187 cannot even be detected. This pronounced depletion of carbon is not accompanied by an obvious nitrogen enhancement, as the N III lines in the spectrum of LS 437 are directly comparable to those in HD 124979. The carbon deficiency probably accounts for the absence of an obvious C II 4267 Å emission feature, as seen in the other Oe stars. An alternative explanation would be emission infilling of the C III lines, as there may be some variability in their strength (although this is very dependent on the normalisation of the low-resolution spectra). Nevertheless, it is difficult to imagine a decretion disk hot enough to drive C III into emission.
3.2. Spectral type and distance
Although we cannot use the main criterion for spectral classification, there are several secondary criteria that can be used to constrain the spectral type of LS 437. The ratios He I 4144 Å/He II 4200 Å and He I 4387 Å/He II 4542 Å unambiguously place the spectral type close to O7 (Sota et al. 2011). The He I lines become very weak at earlier types, with λ4144 nearly undetectable by O6. Conversely, at O8 they are comparable in strength to the He II lines, though still weaker. As can be seen in Fig. 1, these ratios in LS 437 closely match those of the two O7.5 stars shown, and we therefore adopted this as the most likely spectral type for the object. It is worth noting that although the spectrum presented in Negueruela et al. (1996) is noisy, the ratio He I 4471 Å/He II 4541 Å approximately corresponds to O7.5, strongly suggesting that He I 4471 Å was purely photospheric at the time. Consistent with this, the EW of Hβ that they reported is smaller than in any modern spectrum. Assuming that the He I line was still in-filled, the authors favoured a slightly later type.
The strength of He II 4686 Å relative to the other He II lines clearly identifies LS 437 as a dwarf. This line exhibits a very strong negative luminosity dependence. Already in the spectrum of HD 124979 (luminosity class IV), it is considerably weaker.
The Gaia DR3 parallax for LS 437 is ϖ = 0.096 ± 0.017 mas. Using the model of Bailer-Jones (2023), this translates into a photogeometric distance of  kpc. The geometric distance is 7.9 kpc, with larger uncertainties. From a careful analysis of the spectral energy distribution, Riquelme et al. (2012) calculated 7.0 ± 0.5 kpc, although assuming a slightly later O8.5 V spectral type. In view of these values, we adopted 7.6 kpc as the distance to LS 437.
3.3. Stellar parameters
We determined the rotational and main stellar parameters for LS 437 by performing a quantitative spectroscopic analysis based on synthetic FASTWIND models (Santolaya-Rey et al. 1997; Puls et al. 2005), as used in Berlanas et al. (2025) or Herrero et al. (2022). For this purpose, we used the higher resolution spectra from MEGARA, EMMI, and SALT/HRS.
To derive the rotational parameters, we used the iacob-broad tool (Simón-Díaz & Herrero 2007, 2014). This is a user-friendly IDL procedure for the characterisation of line broadening in OB stars based on the combination of Fourier transform (FT) and goodness-of-fit (GOF) methodologies. It allows the user to simultaneously determine the stellar projected rotational velocity (v sin i) and the amount of extra broadening (assuming a radial-tangential profile, vmac) from a specifically selected diagnostic line. The FT technique identifies the first zero in the FT of a given line profile (Gray 2008; Simón-Díaz & Herrero 2007), while the GOF method compares the observed profiles with a synthetic line profile that is convolved with different values of v sin i and vmac to obtain the best-fit by means of a χ2 optimisation.
Finding a line in the spectrum of LS 437 suitable for rotational velocity determination is challenging. The traditional diagnostic feature for O-type stars, O III 5591 Å, is not included in the range covered by the MEGARA spectrum and cannot be clearly seen in the EMMI or SALT/HRS spectra. The Si IV lines lie in the region with a lower S/N and are blended into the wings of Hδ. Lacking any usable metallic line, we based the analysis on the He I 4387 Å line. Although it is weak, it does not seem contaminated by emission and does not suffer from strong Stark broadening. We derived consistent rotational parameters from all available spectra, obtaining v sin i = 155 km s−1 and macroturbulent broadening vmac = 145 km s−1, with excellent agreement between values derived from both the FT and GOF techniques. Uncertainties are in the range of 10−20%.
Once the rotational velocity parameters were established, we used them as input for the iacob-gbat tool (Simón-Díaz et al. 2011) to derive the main spectroscopic parameters, i.e. the effective temperature (Teff), surface gravity (log g), and helium abundance (Y(He)), defined as N(He)/N(H). This tool compares the observed and synthetic line profiles (from FASTWIND models, in our case) by applying a χ2 algorithm. It computes the line-by-line χ2 distributions, estimating the goodness-of-fit for each model within a subgrid of models selected from the global grid. It then iteratively computes the global χ2 distribution, from which the final parameter values and their associated uncertainties are estimated. The final parameters correspond to the mean values computed from all the models located within the 1σ confidence level of the total χ2 distributions (after each model has been weighed by its corresponding χ2 value). Then their uncertainties are given by the standard deviation within the 1σ level. Our grid of models covers the wide range of stellar and wind parameters considered for standard OB-type stars.
We discarded all H and He lines with evident emission features and based the analysis on Hδ, He Iλ4143, λ4387 and He IIλ4200, λ4541, λ4686. Each spectrum was analysed independently, but all yield very similar temperatures, always in the range of 35−36 kK (including estimated uncertainties). We highlight the fact that the emission present in the centre of the Hδ line was cleaned to leave the line wings isolated. Nevertheless, this was insufficient to precisely constrain the surface gravity. Accordingly, we adopted log g as 3.8 dex, which is within the range of possible values, by taking into account the spectral type and the strength of He II 4686 Å, which suggests that the star is not close to the Zero-age main sequence (ZAMS).
In all of our spectra, a change of +0.1 dex in the gravity (i.e. the range of possible values for a luminosity class V star not on the ZAMS) changes the derived temperature by less than 500 K, which lies within the typical 1 kK uncertainty and thus does not affect the final estimates. From the best-fitting models, we obtained a mean value for Teff of 35.9 ± 1.0 kK. These Teff and log g values were later used to determine the carbon and nitrogen abundances (see next subsection).
Assuming a distance of ∼7.6 kpc, the iacob-gbat tool also provides the stellar radius (R), luminosity (log(L/L⊙)), and spectroscopic mass (Msp) when the absolute magnitude, MV, is specified. For this, we adopted the reddening determination of Riquelme et al. (2012) and the Rieke & Lebofsky (1985) extinction law, finding AV = 2.1 and thus MV = −4.7. The main spectroscopic parameters are summarised in Table 2. The traditional Hertzsprung-Russell diagram and its spectroscopic version (sHRD, see Langer & Kudritzki 2014) are shown in Fig. 3 together with Geneva evolutionary tracks (Ekström et al. 2012). The position of LS 437 in both diagrams (marked with a red dot) is consistent with an evolutionary mass close to 30 M⊙, confirming that the adopted surface gravity is appropriate. We found Msp/Mev < 1.0, though we note that the spectroscopic mass was derived using the gravity corrected from centrifugal acceleration.
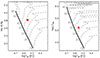 |
Fig. 3. Hertzsprung–Russell diagram (right panel) and its spectroscopic version (left panel) using Geneva rotating evolutionary stellar tracks (vini/vcrit ∼ 0.4). We note that the ℒ parameter is defined in terms of effective temperature and surface gravity as |

Derived spectroscopic parameters for LS 437.
The discrepancy between evolutionary and spectroscopic masses in O-type stars, commonly known as the mass-discrepancy problem, has been widely discussed in the literature (see e.g. Herrero et al. 1992; Massey et al. 2005; Martins et al. 2012; Mahy et al. 2015, 2020; Berlanas et al. 2025). However, no firm consensus has been reached yet regarding its origin. Spectroscopic masses are very sensitive to the adopted extinction, which is subject to significant and often poorly constrained uncertainties that are particularly related to the choice of extinction law. On the other hand, evolutionary masses may change significantly depending on the evolutionary models employed. Since the discrepancy for LS 437 is entirely typical of O-type stars, we could not draw any conclusions.
Given that the analysis of spectra spanning close to 15 years yields mutually consistent values for Teff, we were reassured that variable emission components do not contribute in any significant way to the diagnostic lines used. Our value for Teff is in excellent agreement with the derived spectral type, according to modern calibrations (Martins et al. 2005; Holgado et al. 2025). The inferred absolute magnitude and luminosity are also consistent with expectations. Although they are somewhat higher than average, this is in line with our adoption of log g = 3.8 based on the intensity of He II 4686 Å. The resulting spectroscopic mass is fully consistent with the average value found by Holgado et al. (2025) for O7.5 V stars. The evolutionary mass tabulated for this type is 24 M⊙ (Martins et al. 2005).
3.4. Abundances
To derive carbon (C) and nitrogen (N) abundances, we used a new grid of HHeCNO models calculated with version 10.6.5 of the FASTWIND code and the distributed computation system HTCondor3. These models include the improved N model atom developed and described in Rivero González et al. (2011).
Given the weakness of the diagnostic lines in the spectrum of LS 437 and the relatively low S/N in the blue-violet region, we only sought to constrain the abundances and estimate reliable limits through supervised synthetic profile matching. This approach was preferred over an automated χ2 minimisation, as the latter can be heavily biased by pixel-to-pixel noise fluctuations and small continuum placement uncertainties in a noise-dominated regime. Starting from solar values, we adjusted the abundances iteratively to achieve a better match with the observations. The adopted rotational velocity, Teff, log g, and Y(He) were those derived from the iacob-gbat analysis. Oxygen could not be constrained due to the lack of detectable lines and still imprecise atomic models used in current atmospheric models. Therefore, we focused our analysis on the C and N abundances. We used all the lines available in our spectra except for those too faint or blended with other lines.
The best-fitting model for our spectra, assuming Teff = 36.0 kK, log g = 3.8 dex, and Y(He) = 0.06 dex, corresponds to carbon and nitrogen abundances of 8.05 dex and 8.10 dex, respectively, where abundances are defined as ϵX = 12 + log(X/H) and with solar reference values of 8.35 (C) and 7.80 (N) from Nieva & Simón-Díaz (2011). Assuming the derived uncertainties in temperature, we checked the effect of varying Teff by 1000 K (taking into account the possible corresponding gravity variation). We derived carbon and nitrogen abundance values of 7.75 dex and 7.90 dex, respectively, when assuming Teff = 35 kK. The difference in abundance between these models gave us the uncertainties of our estimates. To ensure the reliability of these constraints, we performed a sensitivity analysis by overplotting synthetic spectra with variations of ±0.05 dex, confirming that such differences are detectable. The best-fitting models are shown in Fig. A.1.
We also examined the possibility that the continuum flux includes a contribution of continuum emission from the circumstellar disk. Assuming a factor of a 10% (see Riquelme et al. 2012), we found no variations in the derived stellar parameters (derived temperature of 36.0 ± 0.8 kK). Even when considering a higher contribution from the disk to the total flux of 20%, the change in temperature is still within the derived uncertainties (Teff = 35.0 ± 1.1 kK). We thus conclude that the possible circumstellar contribution to the stellar flux has a negligible effect on the derived stellar parameters.
3.5. Disk properties
The contribution of the circumstellar disk is evident in the emission lines. All of them appear double-peaked in all the high-resolution spectra. Representative line profiles are shown in Fig. 4. The strong Hα line has a typical morphology for a Be star. According to the classical shape classification of Hanuschik et al. (1996), its profile corresponds to a disk seen at a moderately high inclination, as it is intermediate between the examples illustrated in their Fig. 2. It displays no signs of the wine bottle-type inflections that characterise lower inclination systems. Such features are typically found for inclinations lower than i = 30° to 45°, depending on the physical properties of the disk (Hummel 1994; Lailey & Sigut 2024). The He I lines, which have profiles more typical of optically thin features, are consistent with this inclination estimate.
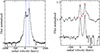 |
Fig. 4. Emission lines seen in the spectrum of LS 437 taken on 2022 March 27 in velocity space. The left panel shows Hα, the strongest emission line in the spectrum, with the two lines marking the position of the peaks. The right panel shows two He I lines, λ5015 (top) and λ5875 (bottom), with crosses marking the position of the peaks. The Fe IIλ5018 line is blended into the red wing of λ5015. |
Interestingly, the EW of Hα measured on our spectra ranges from −7 to −10 Å. Such values are comparable to the highest values measured by Negueruela et al. (1996) in the 1990s.
We made use of the observed emission lines in an attempt to constrain the properties of the circumstellar disk around LS 437. Since the line profiles are quite similar in all three high-resolution spectra, we selected the SALT/HRS spectrum for this purpose, as it has the broadest spectral coverage and a higher S/N over most of the range. We normalised the spectrum and smoothed it with a Gaussian filter (σ = 0.2 Å) to improve the determination of peaks and wing edge detection. We measured the characteristics of the most prominent emission lines, which are reported in Table 3. The parameter vpeak is defined as half the velocity separation between the two peaks, while vwings corresponds to half the separation between the points where the line wings meet the continuum. For the H I and He I lines, we made no attempt to subtract the underlying absorption profiles. Only lines for which vwings can be reliably measured are included in Table 3. Many other weaker lines do not allow for a good definition of this parameter. The strong He I 5015 Å is not included because it is blended with Fe II (see Fig. 4) and He I 6678 Å is excluded because of blending with the absorption feature due to He II 6683 Å.
Measured disk parameters and derived disk sizes for different emission lines.
The peak separation may be used for a rough estimation of disk size since they are expected to reflect the outermost region from which emission in a given ion is arising. Following Huang (1972), we have
 (1)
(1)
where Rout estimates the radial distance from the central star at which this outermost region lies. Taking R* = 9.6 R⊙ and v sin i = 155 km s−1 from our spectroscopic solution and the peak separations measured, we found the values for Rout that are listed in Table 3. As expected, Rout correlates rather well with the transition energy of each line. The He I lines and Hβ all give similar values around 15 R*, with the metallic lines giving slightly shorter distances. The value for Hα is almost certainly unphysical, as it is optically thick, and other physical processes can determine the position of the peaks (Hummel 1994).
3.6. X-ray analysis
Running a Lomb-Scargle periodogram on the full RXTE/ASM light curve revealed a highly significant period at 34.541 ± 0.007 d, which is fully consistent with the 34.46 ± 0.12 d found by Corbet & Peele (1997) for the first 1.5 years of data, which they interpreted as the orbital period of the system. Folding the light curve on this period resulted in the plot shown in Fig. 5 (left panel), where we use phase bins of 0.05 and plot two phase cycles for clarity. We arbitrarily choose MJD 50 000 as phase zero to facilitate comparison with other missions discussed below. The shape is almost identical to that shown by Corbet & Peele (1997), based on a much shorter time span. There is a hint of a secondary peak around phase 0.2, which is not exactly half an orbital period away from the primary peak at ϕ ≈ 0.6.
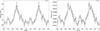 |
Fig. 5. Long-term X-ray light curves folded on the period derived from the Lomb-Scargle analysis. The left panel shows the RossiRXTE (2−12 keV) light curve extending from 1996 January to 2011 December. The right panel displays the Neil Gehrels Swift observatory (15−50 keV) light curve obtained between 2005 February and 2023 February. For ease of comparison, in both plots T0 = 50 000 (MJD) has been chosen. |
We checked the Swift/BAT and MAXI long-term light curves to try and confirm whether this secondary peak is real. We found highly significant periods in the power spectra of the Swift and MAXI light curves at 34.534 ± 0.006 d and 34.534 ± 0.008 d, respectively. The two periods are identical within their formal errors (indeed the calculated values differ by only 7 ms) and are also consistent within errors with the RXTE value. Corbet et al. (2016) had reported a value of 34.548 ± 0.010 d when using about 12 years of Swift data, which is again consistent within the errors. The folded Swift light curve is shown in the right panel of Fig. 5. To allow better comparison, we also used MJD 50 000 as phase zero. The MAXI light curve is not shown, as it is almost identical. The position of the main peak is at approximately the same phase in both plots, although it is somewhat broader in the Swift light curve. One can now see a notable secondary peak in the Swift folded light curve, which is separated by 0.5 in phase from the main peak. This second peak is also visible in the MAXI light curve, roughly 0.5 in phase after the primary, but it is not as clear as in the higher-energy Swift light curve. There are also hints of other peaks in the folded light curves, particularly the MAXI light curves, but it is hard to say whether these are above the error bars.
We also tried folding the Swift and MAXI light curves on the RXTE period for a better comparison between the three datasets. The light curves look very similar to those folded on the periods found for the different satellites. The consistency of the 34.5 d signal over close to 30 years leads very strong support to its interpretation as the orbital period of the system.
4. Discussion
We have carried out a detailed spectroscopic analysis of LS 437. In spite of the scarcity of diagnostic lines, we obtained a consistent set of physical parameters for the star. The true spectral type of the star, if it were not distorted by the emission components, would be around O7.5 Ve, with an absolute magnitude typical of the type, approaching MV = −5. This makes LS 437 the earliest Oe star known in the Galaxy and comparable to the only other mid-Oe star, HD 155806 (Negueruela et al. 2004). The mass of the star is poorly constrained, as the evolutionary mass, ≈28 M⊙, is higher than the spectroscopic mass, ≈22 M⊙. This discrepancy, however, is found for most O-type stars, and we can safely assume an intermediate value of M* ≈ 25 M⊙, which is typical of the type (Martins et al. 2005).
The star shows an obvious underabundance of carbon, with the most likely value being 0.3 dex subsolar, but lower abundances are also possible. Nitrogen is likely slightly enhanced with respect to the standard reference value. However, assuming single evolutionary tracks for single fast-rotating stars, a much higher N enhancement would be expected for a detectable C deficiency. Of course, all evolutionary models for the formation of Be/X-ray binaries imply that LS 437 underwent a phase of mass transfer from the progenitor of the neutron star, and this may help explain its unusual chemistry.
4.1. Peculiar velocity
Determining the radial velocity of LS 437 is not straightforward. There are few and very broad lines, and it is supposed to be a single-lined spectroscopic binary (SB1) system, where changes in radial velocity reflect the orbital motion around the centre of mass. We measured the displacement of the line centres by fitting Gaussian profiles to the He II lines in all the high-resolution spectra. The measured radial velocity is around 110 km s−1 in the heliocentric reference system. The correction to the LSR for this direction is 17 km s−1 using the model of Schönrich et al. (2010). Therefore, the radial velocity of LS 437, vLSR, should be between 90 and 95 km s−1. The model of Reid et al. (2014) predicts a radial velocity of around 85 km s−1 at a distance of 7.6 kpc in this direction. Therefore, the radial component of the peculiar velocity is ≲10 km s−1 for LS 437.
The tangential velocity is more difficult to estimate. In Fig. 6, we show the vector point diagram for distant objects within one degree of LS 437. Since we are probing very long distances and DR3 parallaxes may be negative, our only quality cut is an error in parallax smaller than 0.05 mas. We selected the sample of objects with ϖ < 0.3 mas and mark (in blue) the subsample with ϖ < 0.1 mas, i.e. distances comparable to that of LS 437. The position of LS 437 in the vector point diagram coincides exactly with the highest density of objects in this direction, indicating that its proper motions are typical of distant stars in this part of the sky, which very likely suggests that they are dominated by Galactic rotation. Comparison with the field suggests that LS 437 is very unlikely to have a peculiar motion larger than 0.5 mas, corresponding to < 18 km s−1 at 7.6 kpc.
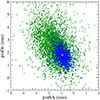 |
Fig. 6. Vector point diagram for distant Gaia sources within 1 degree of LS 437. The green points are objects with ϖ < 0.3 mas, while the blue symbols mark ϖ < 0.1 mas. The position of LS 437 is shown by the red circle. Its error bars are much smaller than the symbol. |
As a further test, we searched the recent catalogue of clusters found in Gaia DR3 data by Hunt & Reffert (2024) for young open clusters with high distances in the neighbourhood. Even if we allow a separation in the sky of 5°, there are only two such clusters, both with estimated distances of around 6.5 kpc. In Table 4, we list their astrometric parameters and compare them to those of LS 437. Again, the differences are in both cases below 0.5 mas.
Astrometric parameters for distant young clusters in the vicinity of LS 437.
In view of this, the 3D peculiar velocity of LS 437 is certain to be smaller than 20 km s−1. Such a low value in a system that must have undergone a supernova explosion is not unexpected, given the high mass of the optical component. In general, BeX display vpec ≲ 40 km s−1 (Nuchvanichakul et al. 2025). The reason(s) for these low peculiar velocities is unclear, but they are usually thought to be a consequence of the evolutionary history leading to the system’s formation. The progenitors of the neutron stars in BeX are generally believed to be reduced to small stellar cores with very thin envelopes in relatively wide orbits before the supernova explosion, resulting in weak natal kicks and low recoil velocities (e.g. Larsen et al. 2024; Nuchvanichakul et al. 2025, and references therein).
4.2. Rotational velocity
Be stars are known to be fast rotators (Townsend et al. 2004). The critical velocity of a star with the observed parameters of LS 437 is in excess of 700 km s−1, but its measured projected rotational velocity is only v sin i ≈ 155 km s−1. Assuming a typical value of vrot = 0.8 ⋅ vcrit, the observed v sin i would imply an inclination angle around i = 15°. Such a low inclination is at odds with the shape of emission lines, which should show strong wine bottle-like inflections.
Motivated by this inconsistency, we rechecked the value of v sin i by applying a somewhat different approach than used by iacob-broad. We applied the FT method, accepted the value given by the first zero, and determined the macroturbulence to fit the profile, thus ignoring the GOF method, which is generally preferred by iacob-broad. For He I 4387 Å, we find then v sin i = 170 km s−1, which is fully consistent with the iacob-broad value within the errors. An attempt to measure the velocity on the He I 4026 Å line, which has a lower S/N, gives v sin i = 135 km s−1, with a higher vmac = 195 km s−1. All the measurements from the He I lines give consistent results and put an upper limit on the total broadening (combined effect of rotation and macroturbulence) around 220 km s−1.
We then applied the technique to the He II lines, although the values obtained are not expected to be very accurate. It is well known that pressure broadening (such as the Stark broadening effect) may significantly affect H and He lines. When v sin i is not very high, He I lines are preferable as rotational velocity diagnostics because they are less affected by Stark broadening than He II lines (see e.g. Simón-Díaz et al. 2006; Ramírez-Agudelo et al. 2013; Simón-Díaz & Herrero 2014). On the other hand, according to stellar surface models (Abdul-Masih 2023), the width of the He II lines in a fast rotator seen at a low inclination should be quite smaller than the width of He I lines, as the He II lines preferentially form in the hotter polar regions. Nevertheless, we consistently found values around v sin i ≈ 200 km s−1 for the He II lines, with a dispersion of around 10%. If we take into account the derived vmac, the He II lines seem to be significantly broader than the He I lines, although the v sin i derived are almost consistent within the errors. This is in agreement with the higher expected pressure broadening and strongly suggests that LS 437 is not a fast rotator seen at low inclination. In any event, if we assume that the inclination angle is in the range i = 30° −40°, as suggested by the shape of the emission lines4, the only possible conclusion is that the star cannot be rotating at much more than half its critical speed.
4.3. X0726–260 and persistent Be/X-ray binaries
Recently, La Palombara et al. (2025a) suggested that X0726−260 must be grouped together with the low-luminosity persistent BeX despite an average X-ray luminosity about one order of magnitude higher than typical of this group. Persistent low-luminosity BeX were first identified as a distinct subclass by Reig & Roche (1999) based on the absence of bright X-ray outbursts, persistent X-ray luminosity typically in the LX ≈ 1034 − 1035 erg s−1 range, and little variability. Other characteristics of the type include long pulse periods, very weak 6.4 keV iron lines in the X-ray spectra and possibly a soft thermal excess in the X-ray spectrum (La Palombara et al. 2025b). This set of characteristics may be interpreted in terms of systems with wide orbits and low eccentricities (Reig & Roche 1999) in which the neutron star accretes directly from a low-density outflow without forming an accretion disk (but see Tsygankov et al. 2017a, for an alternative explanation involving a cold disk). These orbital characteristics suggest that a supernova explosion with a weak kick is necessary to form a persistent Be/X-ray binary.
Podsiadlowski et al. (2004) argued that initial primaries with masses in the 8 − 11 M⊙ range may experience electron-capture supernovae, which will lead to small kick velocities. A second possibility is a very efficient second phase of mass transfer from the neutron star progenitor while it is a He star (case BB). which strips away its whole envelope and reduces it to a naked core, resulting in an ultra-stripped supernova (Richardson et al. 2023). Case BB seems to be very frequent in BeX formation (see e.g. Rocha et al. 2024). The first scenario, which has recently been shown to probably apply to the persistent BeX RX J0146.9+6121 (Marco et al. 2025), does not seem relevant for X0726−260 given the very high mass of LS 437. The second scenario is only applicable if the peculiar velocity is very close to zero, which does not seem to be the case.
There is little reason to support the inclusion of X0726−260 in the group of persistent BeX. For a start, its X-ray luminosity is higher than those typically shown by these objects. Additionally, the short orbital period of X0726−260, which is fully within the range seen in transients with strong outbursts, sets it apart from the persistent BeX. The archetype of the class, X Persei, has an orbital period of 250 d, and the orbital periods of most other persistent systems have not been determined, presumably because they are long. Even systems with relatively short spin periods, such as 1RXS J225352.8+624354 (Psp = 46.7 s), show evidence of quite longer orbital periods (Esposito et al. 2013).
While the long-term light curves of persistent BeX are characterised by secular variations and occasional flaring (e.g. Lutovinov et al. 2012, for X Per), the light curve of X0726−260 is dominated by strong orbital modulation. The Swift light curve, corresponding to hard X-rays, shows very low luminosity at some orbital phases, a very strong peak that covers about one third of the orbital period, and a weaker peak in anti-phase that covers about one tenth of the period. This strong modulation must arise from a non-negligible orbital eccentricity, again at odds with the inferred properties of persistent Be/X-ray binaries.
The orbital parameters of X0726−260 cannot be very dissimilar to those of the BeX transient V0332+53, which presents Porb = 33.9 d and e = 0.37 (Doroshenko et al. 2016). This source, which also contains an Oe star (Negueruela et al. 1999), is a transient, displaying occasional Type II outbursts approaching LX ∼ 1038 erg s−1 and series of Type I outbursts. As a matter of fact, the orbital characteristics of X0726−260 are fully typical of BeX transients.
4.4. Origin of the X-rays
The closest analogue to X0726−260 in terms of X-ray behaviour is the peculiar HMXB 4U 2206+54. This system consists of a neutron star orbiting the O9.5 Vpe star BD +53°2790 (Negueruela & Reig 2001). It displays persistent X-ray emission, with typical luminosities around ∼1035 erg s−1 but sometimes reaching 1036 erg s−1 (Blay et al. 2005). On short timescales, it is characterised by erratic flaring and substantial variability, leading to the suggestion that it is a wind-accreting object (Masetti et al. 2004). Two pointed observations of X0726−260, one with the RossiXTE/PCA in 1997 (Corbet & Peele 1997) and the second with XMM-Newton in 2023 (La Palombara et al. 2025a), found substantial aperiodic variability, with evidence of flaring in the first observation. In contrast, an observation with AstroSat in 2016 found a very stable count rate, with variations below the 50% level (Roy et al. 2020). Such behaviour is typical of wind-fed sources.
Further evidence in this sense can be found in the Porb/Psp (Corbet’s) diagram (Fig. 7). In this plot, BeX display a loose correlation between the two periods, which has been attributed to some form of quasi-equilibrium between spin-up during outbursts and spin-down during quiescence (e.g. Waters & van Kerkwijk 1989; Li & van den Heuvel 1996; Xu & Li 2019). In contrast, all the wind-fed systems fall in an approximate straight line, with spin periods of a few hundred seconds. Exceptions, however, include the peculiar system OAO 1657−415, which has a very evolved mass donor and is likely in a different evolutionary phase (Mason et al. 2012), and the supergiant system 2S 0114+650, which has an extremely long (2.7 h) pulse period and is quickly spinning up (Farrell et al. 2008). X0726−260 occupies a strange position in this diagram: It is well above the BeX but below the wind-fed systems. The position can be considered an intermediate between the two groups.
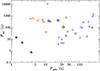 |
Fig. 7. Corbet diagram for a large sample of HMXBs taken from Fortin et al. (2023). Blue circles represent BeX. Orange squares are (supergiant) wind accretors, while maroon circles are Roche-lobe overflow systems. The two BeX with anomalous positions, namely SAX J2103.5+4545 and 1A 1118−615, are represented by larger striped blue circles. The intermediate position of X 0726−260 is displayed by the green diamond. |
The early spectral type of LS 437 makes the possibility of a wind-fed system more likely. Using the LIME simulator (Sundqvist et al. 2025), we found that the wind mass-loss rate for a star similar to LS 437 is on the order of Ṁ ≈ 1.6 × 10⁻⁷ M⊙, which is at least four times higher than for a more typical O9.5 Ve counterpart, suggesting that accretion from the stellar wind may contribute rather more significantly than in any other BeX known. Of course, a key parameter determining the efficiency of wind accretion is the wind terminal velocity (see e.g. Hainich et al. 2020), which we cannot directly measure with existing data. In the case of 4U 2206+54, both IUE (Ribó et al. 2006) and HST (Hainich et al. 2020) observations reveal a very slow wind (v∞ ≈ 400 km s−1), which allows a significantly increased accretion rate with respect to the tabulated value for the spectral type (Ribó et al. 2006).
Nevertheless, some simple geometrical considerations and the application of Kepler’s laws allowed us to make a meaningful comparison, which is shown in Table 5. Barring the unknown wind speed in LS 437, in the table one can see a quite comparable orbital configuration in both systems, while the mass loss rate in LS 437 is expected to be about five times higher. It is worth noting that 4U 2206+54 displayed, during the first few years of RXTE/ASM monitoring, a strong modulation at ∼9.56 days (Corbet & Peele 2001), which was assumed to be the orbital period. After some time, the dominant peak became the frequency corresponding to ∼19.25 days, almost exactly twice the first value (Corbet et al. 2007). With the new ephemeris, the source displays weak X-ray emission peaks half a phase away from the main peak, suggesting that apastron luminosity was initially almost as high as that near periastron, leading to the first periodicity detected. In the case of X0726−260, the observed periodicity is almost certainly the orbital period, as there seems to be a secondary increase in X-ray luminosity close to half a period after the main peak, but varying in phase.
Properties of some peculiar wind-fed system with moderate X-ray luminosity.
Another wind-fed system with moderately increased emission at a phase not corresponding to the X-ray peak is IGR J00370+6122, whose counterpart is a low-luminosity BN0.7 Ib supergiant (González-Galán et al. 2014). In this system, the mass donor is much larger than LS 437, with an estimated R* ≃ 17 R⊙ (González-Galán et al. 2014; Hainich et al. 2020), and the orbit has a high eccentricity, e = 0.56, that allows the neutron star to come close to the surface of the supergiant (see Table 5). This led Hainich et al. (2020) to speculate that the X-ray peaks, which happen some time after periastron, might be related to localised Roche-lobe overflow, although this is probably not necessary to explain the moderate increase in X-ray luminosity. Away from the peak, the luminosity of this system is somewhat below 1035 erg s−1. The mass loss rate from the supergiant is similar to that of BD +53°2790, but the terminal velocity in this case is a rather more typical 1100 km s−1. Again, consideration of the orbital geometry close to apastron shows that the wind parameters of LS 437 do not need to be terribly unusual to produce a comparable X-ray luminosity.
4.5. Disk size and stability
Although the X-ray luminosity of X0726−260 can be explained as a consequence of wind accretion in a moderately eccentric orbit, the observed spectral features of LS 437 can only be explained by the presence of a disk around the primary5. In fact, the main difficulty in explaining the X-ray behaviour of the system is understanding the stability of the X-ray emission and the complete absence of reported outbursts in about 50 years of observations. Well-studied BeX transients, such as 4U 0115+63 or A 0525+262, display cycles of variability, during which features associated with their disks change considerably, sometimes disappearing completely. Along these cycles, they experience Type I and Type II outbursts (Negueruela et al. 2001; Reig et al. 2005). Systems with close (Porb ≲ 100 d) orbits and moderate eccentricities are characterised by series of Type I outbursts (Okazaki & Negueruela 2001). Type II outbursts are frequently associated with major changes in the emission spectrum, leading to the suggestion that large-scale perturbations of the disks lead to their onset (e.g. Negueruela et al. 2001; Martin et al. 2014). The behaviour of X0726−260 has been markedly different.
Among BeX, V0332+53 is the most similar to X0726−260 in terms of the early primary (≈O8.5 Ve) and orbital period (33.9 d). This system is less active than other short-period moderate-eccentricity systems, having undergone three major outbursts during the past 50 years. The high temperature of the primary is expected to be reflected in a higher disk temperature, which in turn results in a higher viscous torque (Okazaki & Negueruela 2001). The higher viscous torque makes truncation by the neutron star more difficult but also leads to a more stable disk. On the other hand, the high mass of the counterpart results in a larger mass ratio, which results in more efficient tidal truncation (Martin et al. 2024). Franchini & Martin (2019) studied the mechanisms that could give rise to Type I outbursts in low-eccentricity systems, such as XTE 1948+32 or 2S 1553−542, concluding that they might not work for Be disks that present a large misalignment with the orbital plane or are flared at the truncation radius. At moderate eccentricities, misaligned disks lead to Type I outbursts and will likely evolve quickly to produce Type II outbursts (Martin et al. 2014).
None of these scenarios seem to apply to LS 437. Although the high-resolution spectra suggest some variation in the relative strength of the blue and red peaks of the emission lines, the features are surprisingly stable over a very long time span. Moreover, the disk size measured with Huang’s approximation (Table 3) suggests a disk larger than the expected periastron distance for all the H and He lines (Table 5). Only the metallic lines are barely compatible with this size. This suggests a breakdown in the assumptions implicit in the approximation and a departure from the typical properties of Be disks.
5. Conclusions
We have carried out a detailed spectroscopic study of LS 437, the optical component of X0726−260. We derived a moderate projected rotational velocity of v sin i ≈ 160 km s−1, which would necessitate a very low inclination angle if the star was rotating at a significant fraction of its critical velocity. Such a low inclination is incompatible with the observed morphology of the emission lines, which instead indicate a moderate viewing angle. From our analysis, we obtained Teff ≈ 36 kK, adopting log g ≈ 3.8, which is in good accord with an apparent spectral type of O7.5 V. Such an early type favours the possibility that the X-ray emission arises, at least in part, from wind accretion. In fact, the position of X0726−260 in the Corbet diagram and the shape of its X-ray light curve suggest that both residual accretion from a truncated disk and wind accretion may contribute.
The system is primarily characterised by its long-term stability, both in X-ray luminosity and the morphology of emission features. There have been no reported X-ray outbursts in about 50 years of monitoring, with luminosity variations remaining within an order of magnitude. Similarly, the source has always displayed moderately strong emission lines (EW of Hα between −6 and −10 Å), with little morphological change. Such behaviour could be easily explained by effective disk truncation by the neutron star companion in a low-eccentricity orbit. However, the strong modulation of the X-ray emission with a 35.5 d period, which must be interpreted as the orbital period of the system, prevents a negligible eccentricity. The BeX transient with more similar orbital parameters to X0726−260, V0332+53, has a measured e = 0.37 and displays Type II outbursts. The very different X-ray behaviours of the two sources are reflected in their spin periods, 4.4 s for V0332+53 and 103 s for X0726−260. If we attribute these diverse behaviours to the eccentricity of the systems, then the combined constraints of a measurable e to display orbital modulation and a significantly lower value than in V0332+53 suggest that the eccentricity in X0726−260 cannot be far from 0.2. As this is a fundamental parameter in order to constrain the origin of the X-ray emission, we will attempt a full orbital solution using a much expanded spectroscopic dataset in a future paper.
In all, the unusual properties of X0726−260, whose closest analogue in terms of X-ray behaviour may be 4U 2206+54, together with its very hot and massive main sequence companion add to the growing complexity of HMXBs. As we accumulate more information about their long-term behaviour, it becomes increasingly difficult to neatly separate these systems into discrete categories.
Acknowledgments
We thank Sergio Simón-Díaz for access to non-public spectra of Oe stars within the IACOB database and Francesc Vilardell for the reduction of the EMMI spectrum. We also thank the anonymous referee for detailed reading and useful suggestions. This research is partially supported by the Spanish Government Ministerio de Ciencia, Innovación y Universidades and Agencia Estatal de Investigación (MCIU/AEI/10.130 39/501 100 011 033/FEDER, UE) under grants PID2021-122397NB-C21/C22 and PID2024-159329NB-C21/22. It is also supported by MCIU with funding from the European Union NextGenerationEU and Generalitat Valenciana in the call Programa de Planes Complementarios de I+D+i (PRTR 2022), project HIAMAS, reference ASFAE/2022/017. SRB acknowledges the support of the Viera y Clavijo program funded by the Agencia Canaria de Investigación, Innovación y Sociedad de la Información del Gobierno de Canarias and the Universidad de la Laguna. LJT acknowledges support from the South African National Research Foundation. Some of the data presented in this paper were obtained with the Southern African Large Telescope under the proposals 2019-2-MLT-004, 2021-2-MLT-005 & 2023-2-MLT-005 (PI: Townsend). This research has made use of the Simbad database, operated at CDS, Strasbourg (France). This work has made use of data from the European Space Agency (ESA) mission Gaia (https://www.cosmos.esa.int/gaia), processed by the Gaia Data Pro- cessing and Analysis Consortium (DPAC, https://www.cosmos.esa.int/web/gaia/dpac/consortium). Funding for the DPAC has been provided by national institutions, in particular the institutions participating in the Gaia Multi-lateral Agreement.
References
- Abdul-Masih, M. 2023, A&A, 669, L11 [NASA ADS] [CrossRef] [EDP Sciences] [Google Scholar]
- Abt, H. A., Tan, H., & Zhou, H. 1997, ApJ, 487, 365 [Google Scholar]
- Bailer-Jones, C. A. L. 2023, AJ, 166, 269 [NASA ADS] [CrossRef] [Google Scholar]
- Berlanas, S. R., Mahy, L., Herrero, A., et al. 2025, A&A, 695, A248 [NASA ADS] [CrossRef] [EDP Sciences] [Google Scholar]
- Blay, P., Ribó, M., Negueruela, I., et al. 2005, A&A, 438, 963 [NASA ADS] [CrossRef] [EDP Sciences] [Google Scholar]
- Blay, P., Negueruela, I., Reig, P., et al. 2006, A&A, 446, 1095 [NASA ADS] [CrossRef] [EDP Sciences] [Google Scholar]
- Boldin, P. A., Tsygankov, S. S., & Lutovinov, A. A. 2013, Astron. Lett., 39, 375 [NASA ADS] [CrossRef] [Google Scholar]
- Cardiel, N., & Pascual, S. 2018, https://doi.org/10.5281/zenodo.2270518 [Google Scholar]
- Cheng, Z. Q., Shao, Y., & Li, X. D. 2014, ApJ, 786, 128 [NASA ADS] [CrossRef] [Google Scholar]
- Corbet, R. H. D. 1986, MNRAS, 220, 1047 [NASA ADS] [CrossRef] [Google Scholar]
- Corbet, R. H. D., & Peele, A. G. 1997, ApJ, 489, L83 [Google Scholar]
- Corbet, R. H. D., & Peele, A. G. 2001, ApJ, 562, 936 [Google Scholar]
- Corbet, R. H. D., Markwardt, C. B., & Tueller, J. 2007, ApJ, 655, 458 [NASA ADS] [CrossRef] [Google Scholar]
- Corbet, R. H. D., Coley, J. B., & Krimm, H. A. 2016, ATel, 9823, 1 [NASA ADS] [Google Scholar]
- Currie, M. J., Berry, D. S., Jenness, T., et al. 2014, ASP Conf. Ser., 485, 391 [Google Scholar]
- Doroshenko, V., Tsygankov, S., & Santangelo, A. 2016, A&A, 589, A72 [NASA ADS] [CrossRef] [EDP Sciences] [Google Scholar]
- Ekström, S., Georgy, C., Eggenberger, P., et al. 2012, A&A, 537, A146 [Google Scholar]
- Esposito, P., Israel, G. L., Sidoli, L., et al. 2013, MNRAS, 433, 2028 [Google Scholar]
- Farrell, S. A., Sood, R. K., O’Neill, P. M., & Dieters, S. 2008, MNRAS, 389, 608 [NASA ADS] [CrossRef] [Google Scholar]
- Fortin, F., García, F., Simaz Bunzel, A., & Chaty, S. 2023, A&A, 671, A149 [NASA ADS] [CrossRef] [EDP Sciences] [Google Scholar]
- Franchini, A., & Martin, R. G. 2019, ApJ, 881, L32 [NASA ADS] [CrossRef] [Google Scholar]
- Golden-Marx, J. B., Oey, M. S., Lamb, J. B., Graus, A. S., & White, A. S. 2016, ApJ, 819, 55 [NASA ADS] [CrossRef] [Google Scholar]
- González-Galán, A., Negueruela, I., Castro, N., et al. 2014, A&A, 566, A131 [NASA ADS] [CrossRef] [EDP Sciences] [Google Scholar]
- Gray, D. F. 2008, The Observation and Analysis of Stellar Photospheres (Cambridge: Cambridge University Press) [Google Scholar]
- Hainich, R., Oskinova, L. M., Torrejón, J. M., et al. 2020, A&A, 634, A49 [NASA ADS] [CrossRef] [EDP Sciences] [Google Scholar]
- Hanuschik, R. W., Hummel, W., Sutorius, E., Dietle, O., & Thimm, G. 1996, A&AS, 116, 309 [NASA ADS] [CrossRef] [EDP Sciences] [Google Scholar]
- Herrero, A., Kudritzki, R. P., Vilchez, J. M., et al. 1992, A&A, 261, 209 [NASA ADS] [Google Scholar]
- Herrero, A., Berlanas, S. R., Gil de Paz, A., et al. 2022, MNRAS, 511, 3113 [NASA ADS] [CrossRef] [Google Scholar]
- Holgado, G., Simón-Díaz, S., Herrero, A., & Barbá, R. H. 2022, A&A, 665, A150 [NASA ADS] [CrossRef] [EDP Sciences] [Google Scholar]
- Holgado, G., Simón-Díaz, S., & Herrero, A. 2025, A&A, 703, A175 [NASA ADS] [CrossRef] [EDP Sciences] [Google Scholar]
- Howarth, I. D., Murray, J., Mills, D., & Berry, D. S. 2014, Astrophysics Source Code Library [record ascl:1405.016] [Google Scholar]
- Huang, S.-S. 1972, ApJ, 171, 549 [NASA ADS] [CrossRef] [Google Scholar]
- Hummel, W. 1994, A&A, 289, 458 [NASA ADS] [Google Scholar]
- Hunt, E. L., & Reffert, S. 2024, A&A, 686, A42 [NASA ADS] [CrossRef] [EDP Sciences] [Google Scholar]
- Klus, H., Ho, W. C. G., Coe, M. J., Corbet, R. H. D., & Townsend, L. J. 2014, MNRAS, 437, 3863 [Google Scholar]
- Kniazev, A. Y., Gvaramadze, V. V., & Berdnikov, L. N. 2016, MNRAS, 459, 3068 [NASA ADS] [CrossRef] [Google Scholar]
- La Palombara, N., Sidoli, L., Mereghetti, S., Esposito, P., & Israel, G. L. 2025a, A&A, 696, A197 [NASA ADS] [CrossRef] [EDP Sciences] [Google Scholar]
- La Palombara, N., Sidoli, L., Mereghetti, S., Israel, G. L., & Esposito, P. 2025b, Astron. Nachr., 346, e20240100 [Google Scholar]
- Lailey, B. D., & Sigut, T. A. A. 2024, MNRAS, 527, 2585 [Google Scholar]
- Langer, N., & Kudritzki, R. P. 2014, A&A, 564, A52 [NASA ADS] [CrossRef] [EDP Sciences] [Google Scholar]
- Larsen, C., Larsen, H. C. G., Pedersen, C. C., et al. 2024, Nature, 625, E18 [Google Scholar]
- Li, X. D., & van den Heuvel, E. P. J. 1996, A&A, 314, L13 [Google Scholar]
- Li, P. P., Becker, P. A., & Tao, L. 2024, A&A, 689, A316 [NASA ADS] [CrossRef] [EDP Sciences] [Google Scholar]
- Lutovinov, A., Tsygankov, S., & Chernyakova, M. 2012, MNRAS, 423, 1978 [NASA ADS] [CrossRef] [Google Scholar]
- Mahy, L., Rauw, G., De Becker, M., Eenens, P., & Flores, C. A. 2015, A&A, 577, A23 [NASA ADS] [CrossRef] [EDP Sciences] [Google Scholar]
- Mahy, L., Almeida, L. A., Sana, H., et al. 2020, A&A, 634, A119 [NASA ADS] [CrossRef] [EDP Sciences] [Google Scholar]
- Maíz Apellániz, J., Sota, A., Arias, J. I., et al. 2016, ApJS, 224, 4 [CrossRef] [Google Scholar]
- Marco, A., & Negueruela, I. 2009, A&A, 493, 79 [NASA ADS] [CrossRef] [EDP Sciences] [Google Scholar]
- Marco, A., Negueruela, I., Castro, N., & Simón-Díaz, S. 2025, MNRAS, 542, 703 [Google Scholar]
- Martin, R. G., Nixon, C., Armitage, P. J., Lubow, S. H., & Price, D. J. 2014, ApJ, 790, L34 [Google Scholar]
- Martin, R. G., Lubow, S. H., Armitage, P. J., & Price, D. J. 2024, MNRAS, 530, 4148 [Google Scholar]
- Martins, F., Schaerer, D., & Hillier, D. J. 2005, A&A, 436, 1049 [NASA ADS] [CrossRef] [EDP Sciences] [Google Scholar]
- Martins, F., Mahy, L., Hillier, D. J., & Rauw, G. 2012, A&A, 538, A39 [NASA ADS] [CrossRef] [EDP Sciences] [Google Scholar]
- Masetti, N., Dal Fiume, D., Amati, L., et al. 2004, A&A, 423, 311 [NASA ADS] [CrossRef] [EDP Sciences] [Google Scholar]
- Mason, A. B., Clark, J. S., Norton, A. J., et al. 2012, MNRAS, 422, 199 [NASA ADS] [CrossRef] [Google Scholar]
- Massey, P., Puls, J., Pauldrach, A. W. A., et al. 2005, ApJ, 627, 477 [NASA ADS] [CrossRef] [Google Scholar]
- Mathew, B., Subramaniam, A., & Bhatt, B. C. 2008, MNRAS, 388, 1879 [NASA ADS] [CrossRef] [Google Scholar]
- McSwain, M. V., & Gies, D. R. 2005, ApJS, 161, 118 [Google Scholar]
- Negueruela, I. 2004, Astron. Nachr., 325, 380 [Google Scholar]
- Negueruela, I., & Reig, P. 2001, A&A, 371, 1056 [NASA ADS] [CrossRef] [EDP Sciences] [Google Scholar]
- Negueruela, I., Roche, P., Buckley, D. A. H., et al. 1996, A&A, 315, 160 [NASA ADS] [Google Scholar]
- Negueruela, I., Roche, P., Fabregat, J., & Coe, M. J. 1999, MNRAS, 307, 695 [NASA ADS] [CrossRef] [Google Scholar]
- Negueruela, I., Okazaki, A. T., Fabregat, J., et al. 2001, A&A, 369, 117 [NASA ADS] [CrossRef] [EDP Sciences] [Google Scholar]
- Negueruela, I., Steele, I. A., & Bernabeu, G. 2004, Astron. Nachr., 325, 749 [Google Scholar]
- Nieva, M. F., & Simón-Díaz, S. 2011, A&A, 532, A2 [CrossRef] [EDP Sciences] [Google Scholar]
- Nuchvanichakul, P., Gandhi, P., Knigge, C., et al. 2025, MNRAS, 543, 1705 [Google Scholar]
- Okazaki, A. T., & Negueruela, I. 2001, A&A, 377, 161 [NASA ADS] [CrossRef] [EDP Sciences] [Google Scholar]
- Pascual, S., Cardiel, N., Picazo-Sanchez, P., Castillo-Morales, A., & Gil De Paz, A. 2018, https://doi.org/10.5281/zenodo.2206856 [Google Scholar]
- Pascual, S., Cardiel, N., Gil de Paz, A., et al. 2019, in Highlights on Spanish Astrophysics X, eds. B. Montesinos, A. Asensio Ramos, F. Buitrago, et al., 227 [Google Scholar]
- Podsiadlowski, P., Langer, N., Poelarends, A. J. T., et al. 2004, ApJ, 612, 1044 [NASA ADS] [CrossRef] [Google Scholar]
- Porter, J. M., & Rivinius, T. 2003, PASP, 115, 1153 [Google Scholar]
- Puls, J., Urbaneja, M. A., Venero, R., et al. 2005, A&A, 435, 669 [NASA ADS] [CrossRef] [EDP Sciences] [Google Scholar]
- Ramírez-Agudelo, O. H., Simón-Díaz, S., Sana, H., et al. 2013, A&A, 560, A29 [NASA ADS] [CrossRef] [EDP Sciences] [Google Scholar]
- Reid, M. J., Menten, K. M., Brunthaler, A., et al. 2014, ApJ, 783, 130 [Google Scholar]
- Reig, P. 2011, Ap&SS, 332, 1 [Google Scholar]
- Reig, P., & Roche, P. 1999, MNRAS, 306, 100 [NASA ADS] [CrossRef] [Google Scholar]
- Reig, P., Fabregat, J., & Coe, M. J. 1997, A&A, 322, 193 [NASA ADS] [Google Scholar]
- Reig, P., Negueruela, I., Papamastorakis, G., Manousakis, A., & Kougentakis, T. 2005, A&A, 440, 637 [NASA ADS] [CrossRef] [EDP Sciences] [Google Scholar]
- Reig, P., Nersesian, A., Zezas, A., Gkouvelis, L., & Coe, M. J. 2016, A&A, 590, A122 [NASA ADS] [CrossRef] [EDP Sciences] [Google Scholar]
- Ribó, M., Negueruela, I., Blay, P., Torrejón, J. M., & Reig, P. 2006, A&A, 449, 687 [NASA ADS] [CrossRef] [EDP Sciences] [Google Scholar]
- Richardson, N. D., Pavao, C. M., Eldridge, J. J., et al. 2023, Nature, 614, 45 [Google Scholar]
- Rieke, G. H., & Lebofsky, M. J. 1985, ApJ, 288, 618 [Google Scholar]
- Riquelme, M. S., Torrejón, J. M., & Negueruela, I. 2012, A&A, 539, A114 [NASA ADS] [CrossRef] [EDP Sciences] [Google Scholar]
- Rivero González, J. G., Puls, J., & Najarro, F. 2011, A&A, 536, A58 [NASA ADS] [CrossRef] [EDP Sciences] [Google Scholar]
- Rocha, K. A., Kalogera, V., Doctor, Z., et al. 2024, ApJ, 971, 133 [Google Scholar]
- Roy, J., Agrawal, P. C., Singari, B., & Misra, R. 2020, RAA, 20, 155 [Google Scholar]
- Santolaya-Rey, A. E., Puls, J., & Herrero, A. 1997, A&A, 323, 488 [NASA ADS] [Google Scholar]
- Schönrich, R., Binney, J., & Dehnen, W. 2010, MNRAS, 403, 1829 [NASA ADS] [CrossRef] [Google Scholar]
- Shortridge, K., Meyerdierks, H., Currie, M. J., et al. 2014, Astrophysics Source Code Library [record ascl:1411.022] [Google Scholar]
- Sigut, T. A. A., Mahjour, A. K., & Tycner, C. 2020, ApJ, 894, 18 [NASA ADS] [CrossRef] [Google Scholar]
- Simón-Díaz, S., & Herrero, A. 2007, A&A, 468, 1063 [NASA ADS] [CrossRef] [EDP Sciences] [Google Scholar]
- Simón-Díaz, S., & Herrero, A. 2014, A&A, 562, A135 [NASA ADS] [CrossRef] [EDP Sciences] [Google Scholar]
- Simón-Díaz, S., Herrero, A., Esteban, C., & Najarro, F. 2006, A&A, 448, 351 [NASA ADS] [CrossRef] [EDP Sciences] [Google Scholar]
- Simón-Díaz, S., Castro, N., Herrero, A., et al. 2011, J. Phys. Conf. Ser., 328, 012021 [Google Scholar]
- Simón-Díaz, S., Negueruela, I., Maíz Apellániz, J., et al. 2015, in Highlights of Spanish Astrophysics VIII, eds. A. J. Cenarro, F. Figueras, C. Hernández-Monteagudo, J. Trujillo Bueno, & L. Valdivielso, 576 [Google Scholar]
- Simón-Díaz, S., Godart, M., Castro, N., et al. 2017, A&A, 597, A22 [CrossRef] [EDP Sciences] [Google Scholar]
- Sota, A., Maíz Apellániz, J., Walborn, N. R., et al. 2011, ApJS, 193, 24 [Google Scholar]
- Sota, A., Maíz Apellániz, J., Morrell, N. I., et al. 2014, ApJS, 211, 10 [Google Scholar]
- Sundqvist, J. O., Debnath, D., Backs, F., et al. 2025, A&A, 703, A284 [NASA ADS] [CrossRef] [EDP Sciences] [Google Scholar]
- Tarasov, A. E., & Malchenko, S. L. 2012, Astron. Lett., 38, 428 [Google Scholar]
- Townsend, R. H. D., Owocki, S. P., & Howarth, I. D. 2004, MNRAS, 350, 189 [Google Scholar]
- Townsend, L. J., Coe, M. J., Corbet, R. H. D., & Hill, A. B. 2011, MNRAS, 416, 1556 [NASA ADS] [CrossRef] [Google Scholar]
- Tsygankov, S. S., Mushtukov, A. A., Suleimanov, V. F., et al. 2017a, A&A, 608, A17 [NASA ADS] [CrossRef] [EDP Sciences] [Google Scholar]
- Tsygankov, S. S., Wijnands, R., Lutovinov, A. A., Degenaar, N., & Poutanen, J. 2017b, MNRAS, 470, 126 [Google Scholar]
- Waters, L. B. F. M., & van Kerkwijk, M. H. 1989, A&A, 223, 196 [Google Scholar]
- Xu, X.-T., & Li, X.-D. 2019, ApJ, 872, 102 [Google Scholar]
- Yang, J., Laycock, S. G. T., Christodoulou, D. M., et al. 2017, ApJ, 839, 119 [NASA ADS] [CrossRef] [Google Scholar]
- Zorec, J., & Briot, D. 1997, A&A, 318, 443 [NASA ADS] [Google Scholar]
http://research.cs.wisc.edu/htcondor/: the supercomputer facility at Instituto de Astrofisica de Canarias.
The results of Sigut et al. (2020) suggest that the inclination could be even higher, although none of the Be stars in their sample is as early as LS 437, which makes this uncertain.
Following convention, LS 437 is referred to as the primary in the current binary because it is by far the most massive component. The progenitor of the neutron star, which was the more massive component before mass transfer, is generally termed the initial or original primary.
Appendix A: Fitting line models
Figure A.1 shows the He, C, and N spectral lines used in our analysis and the FASTWIND best-fitting models to the observed MEGARA spectrum of LS 437.
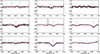 |
Fig. A.1. Best-fit HHeCN models to the observed MEGARA spectrum of LS 437. With a red solid line is shown the model with parameters: Teff = 36.0 kK, log g = 3.8 dex, ξ = 11.0 km s−1, Y(He) = 0.06, log (C/H) = 8.05 dex, log (N/H) = 8.10 dex. With a purple dashed line the model with parameters: Teff = 35.0 kK, log g = 3.8 dex, ξ = 5.0 km s−1, Y(He) = 0.06, log (C/H) = 7.75 dex, log(N/H) = 7.90 dex. C and N lines used in the analysis are indicated with light blue and green vertical lines, respectively. He lines are indicated with dark blue vertical lines for reference. The abundance fits were visually validated against a sensitivity margin of ±0.05 dex. |
All Tables
All Figures
|
Fig. 1. Classification spectrum of LS 437 together with two reference stars, the mild Be HD 155806 (O7.5 Ve) and the moderate rotator HD 124979 (O7.5 IV). Spectral lines of special interest are marked in larger font. See the main text for a detailed description. |
| In the text | |
|
Fig. 2. Detail of the SALT/HRS spectrum displaying the region comprising the Si II 6347 Å and Fe II 6371 Å emission lines. |
| In the text | |
|
Fig. 3. Hertzsprung–Russell diagram (right panel) and its spectroscopic version (left panel) using Geneva rotating evolutionary stellar tracks (vini/vcrit ∼ 0.4). We note that the ℒ parameter is defined in terms of effective temperature and surface gravity as |
| In the text | |
|
Fig. 4. Emission lines seen in the spectrum of LS 437 taken on 2022 March 27 in velocity space. The left panel shows Hα, the strongest emission line in the spectrum, with the two lines marking the position of the peaks. The right panel shows two He I lines, λ5015 (top) and λ5875 (bottom), with crosses marking the position of the peaks. The Fe IIλ5018 line is blended into the red wing of λ5015. |
| In the text | |
|
Fig. 5. Long-term X-ray light curves folded on the period derived from the Lomb-Scargle analysis. The left panel shows the RossiRXTE (2−12 keV) light curve extending from 1996 January to 2011 December. The right panel displays the Neil Gehrels Swift observatory (15−50 keV) light curve obtained between 2005 February and 2023 February. For ease of comparison, in both plots T0 = 50 000 (MJD) has been chosen. |
| In the text | |
|
Fig. 6. Vector point diagram for distant Gaia sources within 1 degree of LS 437. The green points are objects with ϖ < 0.3 mas, while the blue symbols mark ϖ < 0.1 mas. The position of LS 437 is shown by the red circle. Its error bars are much smaller than the symbol. |
| In the text | |
|
Fig. 7. Corbet diagram for a large sample of HMXBs taken from Fortin et al. (2023). Blue circles represent BeX. Orange squares are (supergiant) wind accretors, while maroon circles are Roche-lobe overflow systems. The two BeX with anomalous positions, namely SAX J2103.5+4545 and 1A 1118−615, are represented by larger striped blue circles. The intermediate position of X 0726−260 is displayed by the green diamond. |
| In the text | |
|
Fig. A.1. Best-fit HHeCN models to the observed MEGARA spectrum of LS 437. With a red solid line is shown the model with parameters: Teff = 36.0 kK, log g = 3.8 dex, ξ = 11.0 km s−1, Y(He) = 0.06, log (C/H) = 8.05 dex, log (N/H) = 8.10 dex. With a purple dashed line the model with parameters: Teff = 35.0 kK, log g = 3.8 dex, ξ = 5.0 km s−1, Y(He) = 0.06, log (C/H) = 7.75 dex, log(N/H) = 7.90 dex. C and N lines used in the analysis are indicated with light blue and green vertical lines, respectively. He lines are indicated with dark blue vertical lines for reference. The abundance fits were visually validated against a sensitivity margin of ±0.05 dex. |
| In the text | |
Current usage metrics show cumulative count of Article Views (full-text article views including HTML views, PDF and ePub downloads, according to the available data) and Abstracts Views on Vision4Press platform.
Data correspond to usage on the plateform after 2015. The current usage metrics is available 48-96 hours after online publication and is updated daily on week days.
Initial download of the metrics may take a while.