Fig. 5.
Download original image
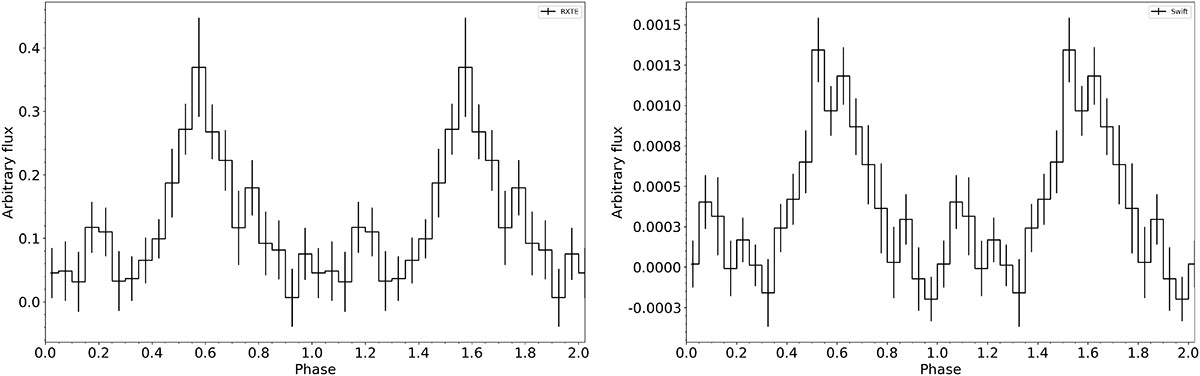
Long-term X-ray light curves folded on the period derived from the Lomb-Scargle analysis. The left panel shows the RossiRXTE (2−12 keV) light curve extending from 1996 January to 2011 December. The right panel displays the Neil Gehrels Swift observatory (15−50 keV) light curve obtained between 2005 February and 2023 February. For ease of comparison, in both plots T0 = 50 000 (MJD) has been chosen.
Current usage metrics show cumulative count of Article Views (full-text article views including HTML views, PDF and ePub downloads, according to the available data) and Abstracts Views on Vision4Press platform.
Data correspond to usage on the plateform after 2015. The current usage metrics is available 48-96 hours after online publication and is updated daily on week days.
Initial download of the metrics may take a while.