Open Access
Fig. 6.
Download original image
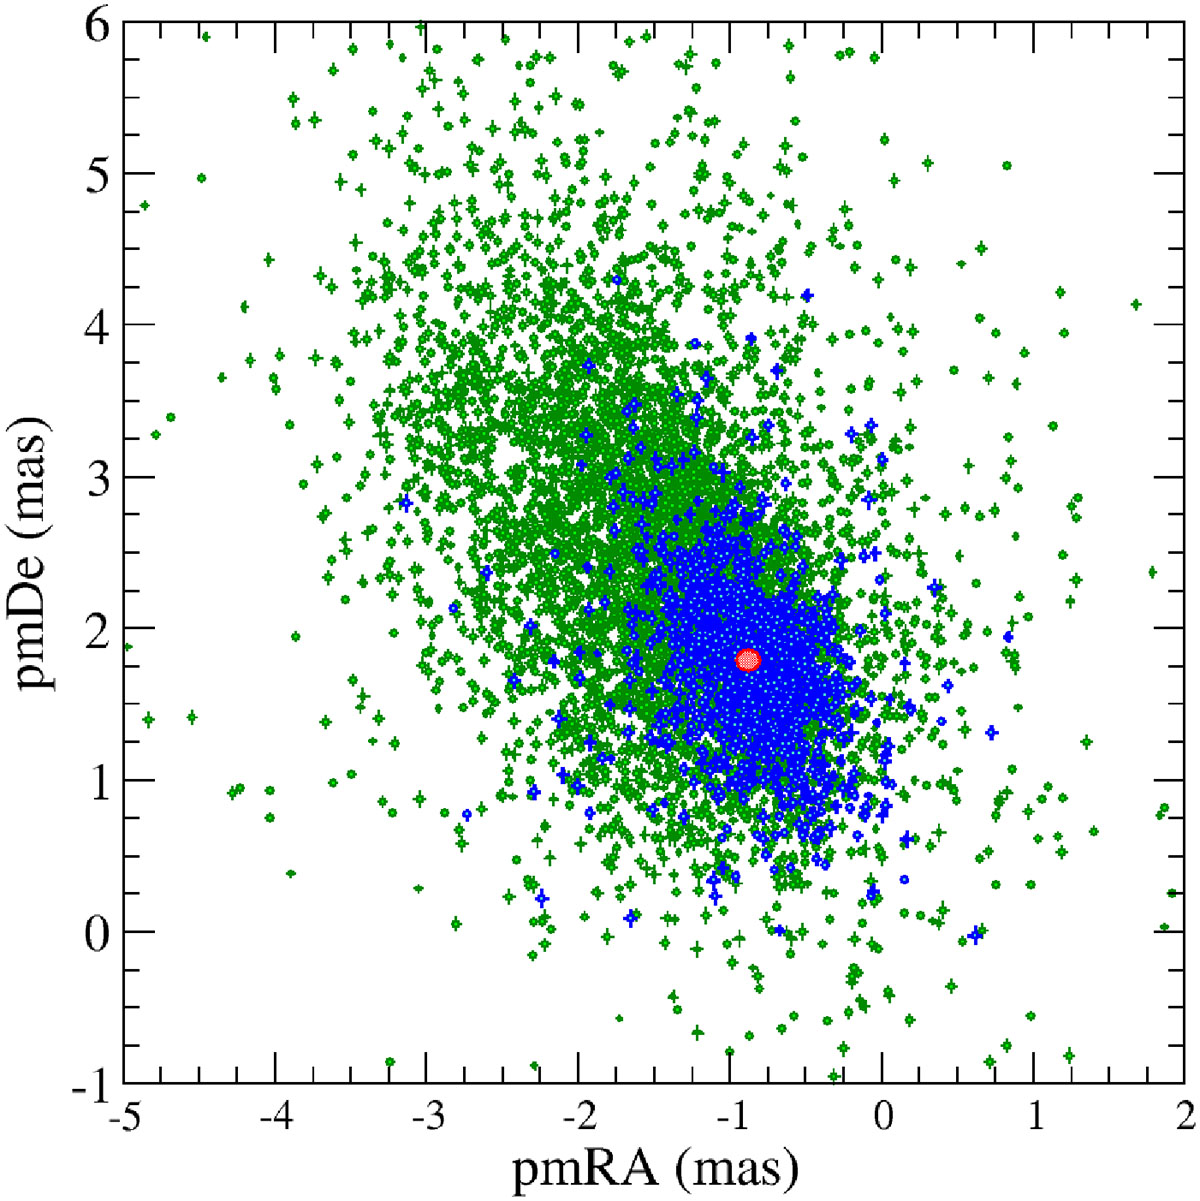
Vector point diagram for distant Gaia sources within 1 degree of LS 437. The green points are objects with ϖ < 0.3 mas, while the blue symbols mark ϖ < 0.1 mas. The position of LS 437 is shown by the red circle. Its error bars are much smaller than the symbol.
Current usage metrics show cumulative count of Article Views (full-text article views including HTML views, PDF and ePub downloads, according to the available data) and Abstracts Views on Vision4Press platform.
Data correspond to usage on the plateform after 2015. The current usage metrics is available 48-96 hours after online publication and is updated daily on week days.
Initial download of the metrics may take a while.