Fig. 2
Download original image
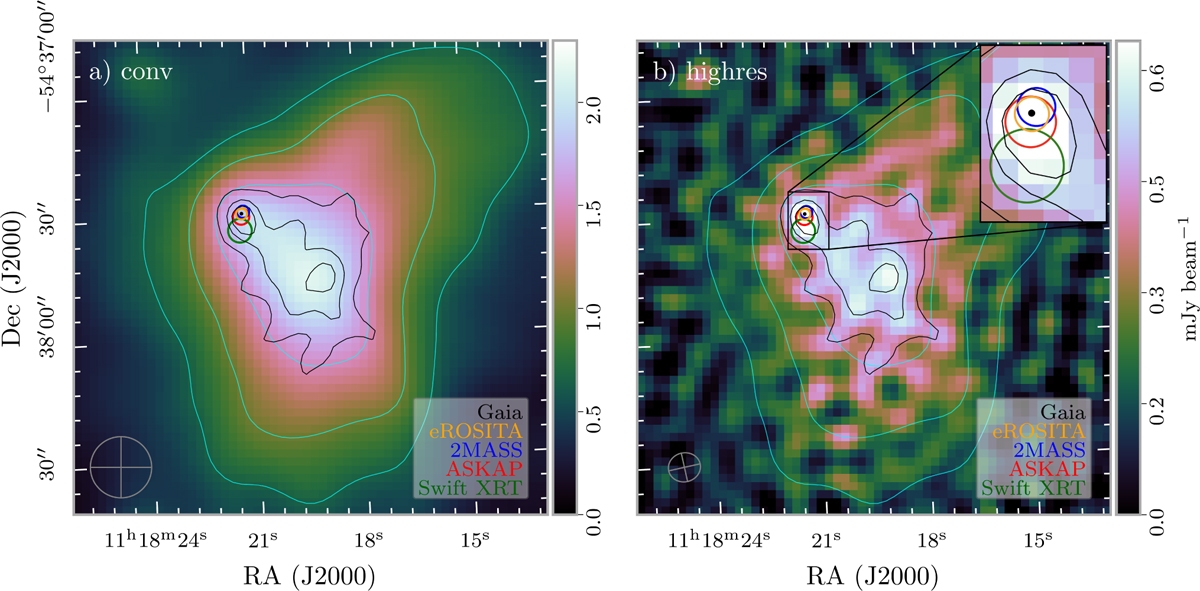
ASKAP-EMU view of the central region of G289.6+5.8. Panel a: standard conv image. Panel b: higher-resolution highres image. The conv image has a uniform resolution of 15″ × 15″, while the highres image has a resolution of 7.9″ × 7.1″. The synthesised beam sizes are given in the lower left corners. The cyan contours correspond to the conv image at levels of 0.625, 1 and 1.5 mJy beam−1. The black contours trace the highres image at 0.4, 0.5 and 0.55 mJy beam−1 levels. The coloured circles mark the sources listed in Table 1, and the circle radii indicate their positional uncertainties. The inset in panel b shows a zoomed-in view of the boxed region surrounding these sources.
Current usage metrics show cumulative count of Article Views (full-text article views including HTML views, PDF and ePub downloads, according to the available data) and Abstracts Views on Vision4Press platform.
Data correspond to usage on the plateform after 2015. The current usage metrics is available 48-96 hours after online publication and is updated daily on week days.
Initial download of the metrics may take a while.