| Issue |
A&A
Volume 710, June 2026
|
|
|---|---|---|
| Article Number | A84 | |
| Number of page(s) | 9 | |
| Section | Interstellar and circumstellar matter | |
| DOI | https://doi.org/10.1051/0004-6361/202659048 | |
| Published online | 02 June 2026 | |
A newborn spider system at the core of a radio shell: Evidence of a low-energy supernova
1
Western Sydney University,
Locked Bag 1797,
Penrith South DC,
NSW
2751,
Australia
2
Australia Telescope National Facility, CSIRO, Space and Astronomy,
PO Box 76,
Epping,
NSW
1710,
Australia
3
Astronomical Observatory,
Volgina 7,
11060
Belgrade,
Serbia
4
Institute of Physics and Astronomy, University of Potsdam,
14476
Potsdam-Golm,
Germany
5
School of Physical Sciences and Centre for Astrophysics & Relativity, Dublin City University,
Glasnevin,
Dublin
D09 W6Y4,
Ireland
6
Astronomy & Astrophysics Section, School of Cosmic Physics, Dublin Institute for Advanced Studies, DIAS Dunsink Observatory,
Dublin
D15 XR2R,
Ireland
7
Department of Physics, The George Washington University,
725 21st St. NW,
Washington,
DC
20052,
USA
8
Max-Planck-Institut für extraterrestrische Physik,
Gießenbachstraße 1,
85748
Garching bei München,
Germany
9
Inter University Centre for Astronomy& Astrophysics, Ganesh-khind,
Pune
411007,
India
10
Departament de Física, EEBE, Universitat Politècnica de Catalunya,
c/Eduard Maristany 16,
08019
Barcelona,
Spain
11
Instituto de Física y Astronomía, Universidad de Valparaíso,
ave. Gran Bretaña, 1111,
Casilla
5030,
Valparaíso,
Chile
12
Millennium Institute of Astrophysics,
Nuncio Monseñor Sotero Sanz 100, Of. 104,
Providencia,
Santiago,
Chile
13
Department of Physics, University of the Free State,
PO Box 339,
Bloemfontein
9300,
South Africa
14
South African Astronomical Observatory,
PO Box 9, Observatory 7935
Cape Town,
South Africa
15
Department of Physics, University of Johannesburg,
PO Box 524,
Auckland Park
2006,
South Africa
16
Dominion Radio Astrophysical Observatory, Herzberg Astronomy & Astrophysics, National Research Council Canada,
PO Box 248,
Penticton,
BC
V2A 6J9,
Canada
17
School of Physics, Chemistry and Earth Sciences, The University of Adelaide,
Adelaide
5005,
Australia
18
Department of Physics, University of Alberta,
Edmonton,
Alberta
T6G 2E1,
Canada
19
Australia Telescope National Facility, CSIRO, Space and Astronomy,
PO Box 1130,
Bentley,
WA
6151,
Australia
20
Department of Physics, University of Wisconsin-Madison,
1150 University Ave.,
Madison,
WI
53706,
USA
21
School of Mathematical and Physical Sciences, Macquarie University,
12 Wally’s Walk,
Macquarie Park
2109,
NSW,
Australia
22
Department of Physics and Astronomy, University of Calgary,
Calgary,
Alberta
T2N 1N4,
Canada
23
School of Natural Sciences, University of Tasmania,
PO Box 807,
Sandy Bay,
TAS
7006,
Australia
★ Corresponding authors: This email address is being protected from spambots. You need JavaScript enabled to view it.
; This email address is being protected from spambots. You need JavaScript enabled to view it.
Received:
20
January
2026
Accepted:
9
April
2026
Abstract
In a search for radio nebulae with a low surface brightness within the ASKAP-EMU survey, we discovered a faint radio shell, G289.6+5.8, and its central point radio source at the position of the soft γ-ray source IGR J11187-5438. The central radio source is spatially coincident with a previously known low-mass X-ray binary (LMXB) with an M-type donor star. However, the newly determined Gaia DR3 distance of 267 pc and correspondingly low X-ray luminosity (3×1031 erg s−1) cast doubt on the LMXB classification. Neither radio nor X-ray pulsations are detected. Chance alignments between radio shell, central radio source, optical star, γ-ray, and X-ray sources appear unlikely. By combining all currently available evidence, we conclude that G289.6+5.8 is a remnant of a low-energy core-collapse explosion of an intermediate-mass star (~8M⊙) in a binary system with an M-type secondary that remained bound after the explosion. In this scenario, G289.6+5.8 is a supernova remnant, while the central γ- and X-ray source is associated with a young neutron star whose pulsar wind interacts with its M-type stellar companion, making IGR J11187-5438 a nascent spider-type X-ray binary.
Key words: radiation mechanisms: non-thermal / stars: low-mass / stars: individual: IGR J11187-5438 / ISM: supernova remnants / ISM: individual objects: SNR G289.6+5.8
© The Authors 2026
 Open Access article, published by EDP Sciences, under the terms of the Creative Commons Attribution License (https://creativecommons.org/licenses/by/4.0), which permits unrestricted use, distribution, and reproduction in any medium, provided the original work is properly cited.
This article is published in open access under the Subscribe to Open model. This email address is being protected from spambots. You need JavaScript enabled to view it. to support open access publication.
1 Introduction
High-cadence optical surveys over the past decade have revealed a growing population of transients with luminosities intermediate between those of classical novae and supernovae (SNe). These gap transients originate from diverse phenomena, including pre-SN outbursts, SN impostors, stellar mergers, and faint core-collapse SNe (ccSNe; Pastorello & Fraser 2019, for a review). A subset of gap transients are intermediate-luminosity red transients (ILRTs), characterised by a slowly rising light curve, a linear decline over about four months, and a spectral evolution from blue to progressively redder colours. While heavily dust-obscured progenitors have been observed for some ILRTs, no post-explosion remnants have been detected (e.g. Bond et al. 2009). This absence suggests a catastrophic origin, with low-energy electron-capture supernovae (ecSNe) proposed as an underlying mechanism (Pastorello & Fraser 2019).
Theoretically, ecSNe are expected to originate in stars with an initial mass of 8-10 M⊙ that develop degenerate O-Ne-Mg cores undergoing rapid electron capture (Nomoto 1987, and references therein). These explosions are predicted to be under-energetic compared to typical ccSNe, with energies of ∼1050 erg (Kitaura et al. 2006), or even as low as 1048 erg based on observational constraints (Stritzinger et al. 2020). Alternative scenarios propose even weaker explosions (∼1047 erg), driven by neutrino mass loss during core collapse (Lovegrove & Woosley 2013). From an evolutionary perspective, ecSNe are favoured in binary systems. Owing to their low explosion energies and lower natal kicks, binaries are more likely to survive such events. Binaries that survive an ecSNe are considered a key formation channel for low-mass X-ray binaries (LMXBs), in which a neutron star (NS) or black hole accretes from a low-mass companion (Podsiadlowski et al. 2004; Ivanova et al. 2008).
During an ecSN, ejecta with kinetic energies 1047−1050 erg expand supersonically into the interstellar medium, driving shocks capable of accelerating relativistic electrons and producing synchrotron radio emission. The observed flux scales as F ∝ Ė/D2, and nearby ecSN remnants might therefore resemble more energetic supernova remnants (SNRs) at much larger distances, making reliable distance estimates essential for their identification. Although ecSNe are theoretically expected to occur at ≤5% of the ccSN rate (Thompson et al. 2009; Botticella et al. 2009), no Galactic remnant of an ecSN has yet been conclusively identified.
New-generation radio facilities such as the Australian Square Kilometre (ASKAP) (Hotan et al. 2021) and MeerKAT (Jonas & MeerKAT Team 2016) provide the sensitivity required to detect such faint Galactic remnants. Their deep surveys have nearly doubled the number of known and candidate SNRs to ~600, most with low surface brightness (Ball et al. 2023, 2025; Anderson et al. 2025). Based on estimated ecSN rates, up to ~24 of these remnants might originate from low-energy explosions, although radio data alone are insufficient for identifying such events.
The paper is structured as follows. In Sect. 2, we report the discovery of a radio shell G289.6+5.8 and its central source. In Sect. 3, we analyse the γ-ray and X-ray source IGR J11187-5438 located at the centre of the shell. In Sect. 4, we argue that a common ILRT origin for the central source and the radio remnant provides the most plausible explanation of the multi-wavelength observations. Our conclusions are given in Sect. 5.
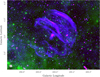 |
Fig. 1 Composite RGB image of G289.6+5.8 showing the large-scale radio structure of the remnant. The image combines the ASKAP-EMU 944 MHz total intensity map (red and blue) with WISE 12 μm emission (green). To emphasise the structure of the source, the radio image is displayed in two different scalings: the red layer uses a linear stretch to highlight the bright filaments and central region, and the blue layer uses a logarithmic stretch to enhance the low surface brightness emission. The 15" synthesised beam is shown in the lower left corner. The γ-ray source IGR J11187-5438 lies within the compact nebula at the centre of the shell. |
2 Low surface brightness radio-shell
The strikingly beautiful extended radio source G289.6+5.8 (see Fig. 1) was serendipitously discovered in ASKAP observations obtained as part of the Evolutionary Map of the Universe survey (EMU; Norris et al. 2021; Hopkins et al. 2025). The source is roughly circular, with an angular extent of ∼36.6′ × 34.4′ and a centre at (RA, Dec)J2000 = 11:18:15.1, −54:37:38. Its morphology shows an asymmetric brightness distribution with two bright filaments in the central to north-west region embedded in faint diffuse emission, and a weaker shell in the south. A bright compact nebula dominates the central region. A zoomed-in view of the centre (Fig. 2) reveals the point source ASKAP J1118-5437 (Table 1). Details of the ASKAP observations and EMU data products are provided in Appendices A and B.
To investigate the nature of the radio emission, we compared the ASKAP-EMU 944 MHz image with the WISE 12 μm map (Wright et al. 2010) (see Fig. 1). Such radio-infrared (IR) comparisons are commonly used to distinguish non-thermal from thermal emission because thermal sources typically show correlated IR emission from heated dust (Ball et al. 2023; Anderson et al. 2025). The absence of an IR counterpart suggests a non-thermal origin for the radio emission, which is characteristic of SNRs.
Following the method described in Ball et al. (2023, 2025), we measured integrated flux densities of 1.42 ± 0.24 Jy for the entire G289.6+5.8 and 0.03 ± 0.01 Jy for its central nebula. Because the extended diffuse emission of G289.6+5.8 has low surface brightness and may be partially resolved out in the interferometric observations (Hopkins et al. 2025), we restricted the spectral analysis to the central region and the brightest filamentary structures. The spectral indices were derived using two independent approaches: in-band spectral fitting, and a Taylorterm analysis of the ASKAP data. The full method is described in Appendix C.
For the central region, we measured spectral indices within three contour-defined areas (cyan contours in Fig. 2). In-band imaging yielded values of α = −0.51 ± 0.26, −0.38 ± 0.18, and −0.28 ± 0.10 for the outer, middle, and inner regions, respectively. These results are consistent with the spectral indices obtained using the Taylor-term technique (Table C.1). The spectral index flattening towards the core indicates freshly accelerated high-energy electrons, which in turn indicate ongoing particle acceleration (Kothes 2017). For the brightest filaments, we derived spectral indices of α = −0.76 ± 0.56 for the outer filament and −0.56 ± 0.32 for the inner filament, again consistent with the Taylor-term analysis. Although the uncertainties are relatively large, the measured values are broadly consistent with the canonical spectral index expected for non-thermal synchrotron emission (Filipović & Tothill 2021).
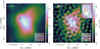 |
Fig. 2 ASKAP-EMU view of the central region of G289.6+5.8. Panel a: standard conv image. Panel b: higher-resolution highres image. The conv image has a uniform resolution of 15″ × 15″, while the highres image has a resolution of 7.9″ × 7.1″. The synthesised beam sizes are given in the lower left corners. The cyan contours correspond to the conv image at levels of 0.625, 1 and 1.5 mJy beam−1. The black contours trace the highres image at 0.4, 0.5 and 0.55 mJy beam−1 levels. The coloured circles mark the sources listed in Table 1, and the circle radii indicate their positional uncertainties. The inset in panel b shows a zoomed-in view of the boxed region surrounding these sources. |
3 The central source of the radio nebula
Long before G289.6+5.8 was discovered, the soft γ-ray source IGR J11187-5438 was detected by the INTEGRALIBIS/ISGRI telescope (Bird et al. 2007, 2016). Follow-up observations with the Swift XRT (Rodriguez et al. 2008) confirmed the X-ray counterpart and constrained the line-of-sight absorption, deriving a hydrogen column density of NH ≈ 2.8 ×1021 cm−2. Coleiro et al. (2013) identified potential infrared and optical counterparts in the 2MASS and the DSS II catalogues, based on which IGR J11187-5438 was classified as an LMXB. However, the unknown distance to the source precluded a reliable determination of its X-ray luminosity.
Our discovery of the radio nebula G289.6+5.8, encompassing IGR J11187-5438, reignites interest in the true nature of the source. For convenience, we refer to this source as the central source of the radio nebula (CSRN) throughout the rest of the paper.
Crucial insights into the CSRN come from the eROSITA point source catalogue (Merloni et al. 2024), which provides the most precise localisation among the available high-energy observations of the region. The X-ray point source 1eRASS J111821.2-543729 positionally coincides with the INTEGRAL detection and the radio point source (see Table 1), and no other X-ray sources are detected in its immediate vicin-ity1. The combined spectra of eROSITA, Swift XRT, Swift BAT, and INTEGRAL agree well (see Fig. 3), indicating a common origin for all four datasets and yielding a relatively hard photon index of Γ = 1.36 ± 0.03. The details of the spectral extraction and analysis are given in Sect. 3.1.
In the eRASS1 coronal source catalogue (Freund et al. 2024), our source is associated with Gaia DR3 5346688272924690432, hereafter Gaia 32, with a matching probability of 92%. Gaia 32 is an M3-type star located at a distance of d ≈ 267± 9 pc. However, the observed X-ray properties are inconsistent with those expected from typical coronal emission of late-type stars. The source exhibits an unusually hard X-ray spectrum (Γ =1.36 ± 0.03) and an extremely fractional X-ray flux of log(FX/Fbol) = −0.7, far above the levels expected for stellar coronal emission. Explaining this emission through coronal activity alone would require an exceptionally strong flare, but the eRASS1 light curve is relatively stable and shows no evidence of major flaring activity. Therefore, Freund et al. (2024) classified the source as non-coronal, implying that the X-ray emission associated with Gaia 32 is unlikely to originate from coronal activity alone (see Sect. 3.2 for catalogue details).
We obtained optical spectroscopy of Gaia 32 with the 4.1 m SOAR telescope. The spectrum shows features of a cool star consistent with an M3 type (Fig. D.1). However, contamination from a bright star located only 6″ away (Fig. D.2) reduces the signal-to-noise ratio and may obscure subtle signatures of interaction with a compact companion. We also obtained optical photometry with the 1.9 m and 1.0 m SAAO telescopes, which showed no significant variability. Details of the optical observations and data reduction are presented in Appendix D. Additionally, Gaia astrometry reveals no notable astrometric_excess_noise compared to nearby stars of similar brightness, providing no evidence of binarity.
Finally, we quantified the probability of a chance alignment of the radio shell, the X-ray detections, and the Gaia/2MASS counterpart. The resulting probability is p ≲ 10−3, indicating that the observed configuration is unlikely to occur by chance, and it strongly supports a physical association between these sources (see Sect. 3.3 for a detailed probability calculation).
Multi-wavelength counterparts of the CSRN.
3.1 X-ray properties of CSRN
To investigate the nature of the CSRN, we examined the positional consistency of the multi-wavelength counterparts and the X-ray properties of available X-ray observations. In Table 1, we list all CSRN counterparts together with their positional uncertainties and angular separations relative to Gaia 32. Their positions and uncertainties are overlaid in Fig. 2a.
The ASKAP point source and 1eRASS J111821.2-543729 are both consistent with the Gaia 32 position within their respective uncertainties. The position of 2SXPS J111821.3-543733 in the 2SXPS Catalogue of Swift XRT Point Sources (clean version) is offset by approximately 4″ from 1eRASS J111821.2-543729, which has the smallest X-ray positional uncertainty. Given the Swift XRT statistical uncertainty of 2.9″ (90% confidence), this offset corresponds to a deviation of only ~2σ and is therefore not significant. Moreover, the Swift XRT pointing accuracy carries an additional ∼3″ systematic uncertainty that is not accounted for here. Although the INTEGRAL IBIS/ISGRI detection is spatially associated with 1eRASS J111821.2-543729, its large positional uncertainty (≈3.5′) prevents a meaningful astrometric comparison. The association is instead supported by the absence of any alternative X-ray source within the INTEGRAL localisation region.
We summarise the available X-ray observations of the CSRN as follows. The Swift XRT data, shown in Fig. 3, were obtained using the XRT product generator2, while the Swift BAT and INTEGRAL IBIS/ISGRI data were extracted using the HEAVENS online tool3. The eRASS1 spectral products were downloaded from the eROSITA-DE DR1 public archive4. The combined X-ray spectrum is well described by an absorbed power-law model tbabs ×po fitted in XSPEC, yielding a hydrogen column density of NH = 3.1 ± 0.3 × 1021 cm−2 and a photon index of Γ = 1.36 ± 0.03. These parameters give a good fit with χ2 = 203.3 for 203 degrees of freedom. The fluxes measured by each instrument are provided in Table 2.
The absorption column density measured from X-ray spectra is consistent with the total Galactic column density in the direction of G289.6+5.8 if the CSRN were located at a distance >4 kpc. On the other hand, at a distance of 267 pc, the measured column density would require additional absorption inside the system corresponding to the extinction E (B-V) ∼ 1 (Güver & Özel 2009).
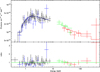 |
Fig. 3 Top: broad-band X-ray spectrum of the CSRN obtained with eROSITA (blue), Swift XRT (black), Swift BAT (green), and INTEGRAL IBIS/ISGRI (red). The solid line shows the best-fitting absorbed power-law model. Bottom: Ratio of the data to the model. |
Observed X-ray fluxes of the CSRN measured with INTE-GRALIBIS/ISGRI, Swift BAT, Swift XRT, and eROSITA (eRASS1).
3.2 1eRASS J111821.2-543729 analysis
The optical counterpart of 1eRASS J111821.2-543729 is star Gaia 32. Gaia 32 has an apparent magnitude of G ≈ 18.45 mag and lies at a distance of d ≈ 267± 9 pc (Gaia Collaboration 2023). Gaia DR3 photometry gives a colour of BP - RP ≈ 2.89 mag, corresponding to a reddening of EBP-RP ≈ 0.38 mag and an effective temperature of Teff ≈ 3323 K. These parameters are consistent with an M3 spectral type. In the Gaia colour-magnitude diagram, the source lies approximately 0.7 mag below the main sequence.
Freund et al. (2024) flagged the source as non-coronal based on several properties atypical for stellar coronal emission. Coronal X-ray emitters usually exhibit soft spectra, whereas 1eRASS J111821.2-543729 shows a relatively hard spectrum with a photon index of Γ = 1.36 ± 0.03. Another key diagnostic is the X-ray to bolometric flux ratio. For coronal emitters, this ratio typically saturates at log(FX/Fbol) ≈ −3 (Vilhu 1984; Wright et al. 2011) and may increase for individual sources by roughly an order of magnitude due to variability (Freund et al. 2024). For Gaia 32, however, we derived a much higher value of log(FX/Fbol) = −0.7 when adopting stellar bolometric corrections. This value exceeds those observed even in the most active coronal systems, including RS Canum Venaticorum-type binaries (Dempsey et al. 1993). Additionally, the light curve of the eRASS1 source is stable. Taken together, these properties indicate that the observed X-ray emission cannot be explained by coronal activity from an M3 star alone (Freund et al. 2024). Such a hard spectrum is typical of accreting compact objects or pulsar wind nebula (PWN), but is unusual for stellar coronal emission.
3.3 Chance alignment probabilities
We treated the hard X-ray detections (INTEGRAL, Swift BAT, Swift XRT, and eROSITA) and the compact central radio source as physically associated based on their mutual positional consistency (Table 1) and the broad-band spectral agreement (Sect. 3.1). The only a priori questionable associations are the optical and IR objects (Gaia and 2MASS sources) with the X-ray source, and the probability of finding them projected near the centre of the radio shell.
To quantify these chance coincidence probabilities, we modelled the spatial distribution of unrelated sources as a Poisson process and computed the probability5 of finding at least one unrelated catalogue object within the specified area. Because Gaia and 2MASS detections are not statistically independent, we used the 2MASS catalogue6 to characterise the population of sources detectable in the optical and near-IR within 1° of G289.6+5.8. After converting the 1σ positional uncertainty of the eRASS1 source into a 90% confidence radius, we estimated the probability that an unrelated Gaia/2MASS source lies within the eRASS1 localisation region as pGaia∩2MASS,eRAss 1 = 0.0687. This value should be regarded as a conservative upper limit because we applied no filtering on magnitude, colour, or stellar type and the 2MASS surface density provides only an approximation to the joint Gaia-2MASS population. Similarly, we then calculated the probability for a hard X-ray source to fall within the central 10% of the radio shell area (corresponding to a radius of 5.6′). Using the eROSITA-DE DR1 archive, we obtained a probability of peRASs 1,10%SNR = 0.0017.
When we assume an approximate independence between the spatial distribution of eROSITA sources within the inner 10% of the radio shell and the presence of unrelated Gaia/2MASS sources within the eROSITA localisation region, the combined probability of such a chance configuration is Ptotal = 0.0012 (0.12%). This estimate should be regarded as an upper limit to the true chance-alignment probability. A combined probability of ∼10−3 indicates that a purely chance superposition of the X-ray sources, the optical/near-IR counterpart, and the radio shell is highly unlikely.
4 The nature of G289.6+5.8 and CSRN
The CSRN was initially classified as an LMXB. By analogy with the small number of high-mass X-ray binaries associated with SNRs, the surrounding radio shell G289.6+5.8 might in principle be interpreted as the remnant of the SN that formed the compact object (e.g. Hénault-Brunet et al. 2012; Maitra et al. 2021). However, the LMXB phase is expected to occur long after the SN explosion, on timescales that are not compatible with the presence of a detectable remnant (Lin et al. 2011). Moreover, the extreme stellar mass ratios required for such systems make the survival of the binary through the SN event unlikely. We therefore considered alternative explanations for the nature of the CSRN and its relation to G289.6+5.8.
4.1 Nearby low-luminosity SN with a peculiar central source
Given the low probability of chance alignment, we considered the radio, X-ray, and optical/near-IR emission to be physically associated, placing the system at the distance of d ≈ 267 ± 9 pc. The morphology of radio shell G289.6+5.8 (Fig. 1), together with the absence of extended X-ray emission, suggests a dynamically evolved SNR, similar to several recently detected faint remnants (e.g. Filipović et al. 2023, 2024). The current shock velocity is therefore likely a few hundred km s−1, such that freshly accelerated electrons reach only modest maximum energies and are unable to produce detectable non-thermal X-ray emission, for example as observed in RCW 86 (Williams et al. 2011); see also Vink et al. (2006). At the same time, the relatively uniform radio morphology does not indicate strong interaction with a dense interstellar cloud, which would produce localised enhancements in the radio brightness. The emission suggests that the shock must remain sufficiently strong to sustain the acceleration of radio-emitting electrons. This suggests a shock velocity in the range ∼ 100 km s−1 ≲ vsh ≲ 1000 km s−1.
If it has a low ejected mass, G289.6+5.8 would already be in the Sedov phase, but for a canonical explosion energy of 1051 erg, this would imply an age of only ∼ 100 yr (see Table 3), which is implausibly young. This discrepancy can be resolved if G289.6+5.8 resulted from a low-energy explosion with kinetic energies well below the canonical core-collapse value. For explosion energies of 1047−1048 erg, the inferred remnant age increases to several hundred thousand years while maintaining shock velocities sufficient to produce the observed radio synchrotron emission. These energies are consistent with weak ccSNe involving neutrino-induced mass loss or ecSNe, both of which require lighter progenitors (8-10 M⊙). These explosions are expected to impart relatively small natal kicks to the NS, increasing the likelihood of binary survival. These explosion scenarios are explored in more detail below.
The CSRN has an X-ray luminosity of LX ≈ 3 ×1031 erg s−1 and a hard spectrum with a photon index of Γ =1.36 ± 0.03 (Sect. 3.1). These properties are difficult to reconcile with coronal emission from a normal star (Sect. 3.2) and lie orders of magnitude below typical luminosities of LMXBs (LX > 1034 erg s−1, Bahramian & Degenaar 2023). Instead, they are consistent with those of spider pulsars, a class of millisecond pulsars (MSPs) in compact binaries with low-mass companions (Hui & Li 2019). In these systems, a relativistic pulsar wind collides with and blows away the outer layers of the optical star, producing high-energy emission from an intra-binary shock rather than from accretion.
We interpret Gaia 32 as a low-mass companion interacting with a recently formed NS, representing a pre-MSP evolutionary stage. In this scenario, the CSRN may eventually evolve into a classical spider pulsar once mass transfer spins the NS up and ablation of the companion becomes efficient. The CSRN can therefore be viewed as a candidate baby spider system, observed shortly after NS formation, possibly in a wider and eccentric orbit, as expected following a natal kick.
Low-energy explosion scenarios
We explored several plausible explosion mechanisms for G289.6 + 5.8 by comparing their characteristic energy scales with the dynamical constraints inferred from the remnant size and ambient density. In Table 3 we summarise the Sedov age estimates obtained for several assumed distances, adopting ambient H I densities from Misiriotis et al. (2006). For distances of a few kiloparsec, the derived ages range from a few to several dozen billion years, consistent with an evolved SNR expanding in a low-density medium. In contrast, adopting the nearby distance of the Gaia 32 counterpart yields an extremely young age of only ∼100 yr for a canonical explosion energy. Therefore, reconciling the observed remnant size with a small distance requires a substantially lower explosion energy, motivating the exploration of low-energy explosion scenarios.
(Classical) Novae. Novae are known to be efficient particle accelerators (H.E.S.S. Collaboration 2022), with typical explosion energies of E ≈ 1044 erg and a theoretical upper limit of ∼ 1045 erg (Kato et al. 2022). Although recurrent novae may reach higher cumulative ejecta energies, no nova has been reported in the direction of G289.6+5.8. For explosion energies of 10441045 erg, the inferred Sedov ages span ∼ 18-68 kyr. At these ages, the present-day shock velocities would be only 42-93 km s−1, which is far too low to account for the observed non-thermal radio synchrotron emission. We therefore rule out a nova origin for G289.6+5.8.
Neutrino mass-loss explosions. Weak core-collapse explosions driven by neutrino-induced mass loss have been proposed as a possible outcome of stellar core collapse when the explosion energy is insufficient to launch a strong outgoing shock. Numerical simulations by Lovegrove & Woosley (2013) showed that even in the absence of an outward-propagating shock, the hydrodynamic response to abrupt neutrino mass loss from the collapsing core can generate a weak explosion with characteristic energies of about E ~ 1047 erg. When we adopt such an explosion energy for G289.6+5.8, we derive an inferred remnant age of ∼1.8kyr and a present-day shock velocity of ∼400kms−1. This is consistent with efficient particle acceleration and the observed radio synchrotron emission.
ILRT theoretical expectations. The ILRTs have been proposed as the observational outcome of low-energy ecSNe (Pastorello & Fraser 2019). Early theoretical models predicted explosion energies of about E ∼ 1050 erg for ecSNe (Kitaura et al. 2006). However, this energy for G289.6+5.8 would place the remnant in the free-expansion phase of evolution, implying an age of only ∼ 100 yr and an unrealistically high shock velocity. This is inconsistent with the observed radio shell.
ILRT observational constraints. Recent observational studies of ecSNe from progenitors in the mass range of 810 M⊙ suggested substantially lower explosion energies of about E ∼ 1048 erg (Stritzinger et al. 2020). An energy for G289.6+5.8 like this yields a physically plausible solution, with an age of ∼600 yr and a shock velocity of ∼700 km s−1. This is consistent with efficient particle acceleration and the observed non-thermal radio emission.
4.2 Distant SNR hosting a young rotation-powered pulsar
To test whether a more conventional interpretation can explain the observed properties, we also considered a scenario in which the CSRN represents a PWN located at the centre of G289.6+5.8. In this case, the apparent spatial coincidence between the X-ray and optical/near-IR sources is due to chance alignment. The hard X-ray spectrum of the CSRN is consistent with that observed for young rotation-powered pulsars (RPPs) and their PWNe (Kargaltsev & Pavlov 2008). The radio spectral index flattens towards the core and is compatible with synchrotron emission from a PWN (Kothes 2017). In addition, the CSRN exhibits an X-ray to radio luminosity ratio of LX/LR ≈ 9000, which is comparable with the highest values observed for young PWNe.
The morphology and dynamical properties of the radio shell indicate an evolved SNR, with an age of ∼10kyr at a distance of a few kiloparsec assuming a canonical explosion energy of 1051 erg (Table 3). A fiducial distance of 4kpc yields an X-ray luminosity of LX ∼ 1034 erg s−1 and a 1.4 GHz radio luminosity of LR ∼ 1030 erg s−1 for the CSRN. While the X-ray luminosity is moderate, the radio luminosity places the CSRN at the extreme low end of young PWNe. Thus, the high luminosity ratio arises from suppressed radio emission and not from unusually strong X-ray output. This behaviour is difficult to explain with standard evolutionary models, in which young PWNe are also radio bright (Kothes 2017).
At an optimistic X-ray efficiency (η = 0.1), the inferred luminosity implies a pulsar spin-down power of at least 1035 ergs−1 (Vink et al. 2011). Pulsars with comparable energetics typically produce detectable γ-ray emission, particularly at off-plane locations where the background contamination is low (Smith et al. 2023). However, the closest Fermi-LAT source is associated with AGNMGPS J111715-533816 and ∼1° from the CSRN (Ballet et al. 2023). We also conducted a pulsar search observation, but no pulsations were detected (Appendix E). Hence, even if an isolated NS scenario appears less exotic, the unusual properties of the CSRN indicate that it is special.
5 Summary and conclusions
We reported the discovery of G289.6+5.8, a radio shell with a low surface brightness identified in ASKAP-EMU data (Fig. 1). Its morphology and non-thermal spectrum strongly support an SNR interpretation. A compact radio nebula at its centre hosts the soft γ-ray source IGR J11187-5438. The γ-ray source is spatially coincident with a hard X-ray source previously classified as an LMXB, with an M3-type stellar optical counterpart. However, its Gaia DR3 distance implies that the X-ray luminosity is far too low for a typical LMXB.
Based on the currently available data, the G289.6+5.8 properties favour a low-energy explosion from an intermediate-mass progenitor in which a young NS remains bound to its stellar companion. If this were confirmed, G289.6+5.8 would represent the first Galactic remnant of an ILRT hosting a binary system, providing a unique link between such transients, NS formation, and the early evolution of spider pulsars. A more conventional alternative in which the optical star is a chance alignment and IGR J11187-5438 is an isolated NS embedded in a distant evolved SNR cannot be excluded. However, it would require an unusually radio-faint PWN with a high X-ray to radio luminosity ratio.
Further multi-wavelength follow-up observations are essential to distinguish between these scenarios and to establish the true nature of this intriguing system.
Acknowledgements
The authors are grateful to Dr. Jesús Maiz Apellániz for his insights and advice on the properties of DR3 5346688272924690432 as inferred from the Gaia catalogues. This scientific work uses data obtained from Inyarrimanha Ilgari Bundara, the CSIRO Murchison Radio-astronomy Observatory. We acknowledge the Wajarri Yamaji People as the Traditional Owners and native title holders of the Observatory site. CSIRO’s ASKAP radio telescope is part of the Australia Telescope National Facility (ATNF) (https://ror.org/05qajvd42). Operation of ASKAP is funded by the Australian Government with support from the National Collaborative Research Infrastructure Strategy. ASKAP uses the resources of the Pawsey Supercomputing Research Centre. Establishment of ASKAP Inyarrimanha Ilgari Bundara, the CSIRO Murchison Radio-astronomy Observatory and the Pawsey Supercomputing Research Centre are initiatives of the Australian Government, with support from the Government of Western Australia and the Science and Industry Endowment Fund. Murriyang, CSIRO’s Parkes radio telescope, is part of the ATNF. We acknowledge the Wiradjuri people as the Traditional Owners of the Observatory site. This work uses observations obtained at the Southern Astrophysical Research (SOAR) telescope, which is a joint project of the Ministério da Ciência, Tecnologia e Inovações (MCTI/LNA) do Brasil, the US National Science Foundation’s NOIRLab, the University of North Carolina at Chapel Hill (UNC), and Michigan State University (MSU). SL, MDF, and GR acknowledge the Australian Research Council funding through grant DP200100784. MC acknowledge support from the European Space Agency (ESA) in the framework of the PRODEX Programme (PEA 4000120711). ZG and JO are supported by the China-Chile Joint Research Fund (CCJRF No.2301), the Chinese Academy of Sciences South America Center for Astronomy (CASSACA, Key Research Project E52H540301), and ANID, Millennium Science Initiative (AIM23-001). BvS acknowledges support by the National Research Foundation of South Africa (grant number 119430). This research has made use of NASA’s Astrophysics Data System (Kurtz et al. 2000), the SIMBAD database (Wenger et al. 2000) and Astropy (Astropy Collaboration 2013) at various stages of the analysis.
References
- Allard, F., Homeier, D., & Freytag, B. 2011, ASP Conf. Ser., 448, 91 [Google Scholar]
- Anderson, L. D., Camilo, F., Faerber, T., et al. 2025, A&A, 693, A247 [NASA ADS] [CrossRef] [EDP Sciences] [Google Scholar]
- Astropy Collaboration (Robitaille, T. P., et al.) 2013, A&A, 558, A33 [NASA ADS] [CrossRef] [EDP Sciences] [Google Scholar]
- Bahramian, A., & Degenaar, N. 2023, Low-Mass X-ray Binaries (Nat), 120 [Google Scholar]
- Ball, B. D., Kothes, R., Rosolowsky, E., et al. 2023, MNRAS, 524, 1396 [NASA ADS] [CrossRef] [Google Scholar]
- Ball, B. D., Kothes, R., Rosolowsky, E., et al. 2025, ApJ, 988, 75 [Google Scholar]
- Ballet, J., Bruel, P., Burnett, T. H., Lott, B., & The Fermi-LAT collaboration 2023, arXiv e-prints [arXiv:2307.12546] [Google Scholar]
- Bird, A. J., Bazzano, A., Malizia, A., et al. 2016, ApJS, 223, 15 [Google Scholar]
- Bird, A. J., Malizia, A., Bazzano, A., et al. 2007, ApJS, 170, 175 [Google Scholar]
- Bond, H. E., Bedin, L. R., Bonanos, A. Z., et al. 2009, ApJ, 695, L154 [Google Scholar]
- Botticella, M. T., Pastorello, A., Smartt, S. J., et al. 2009, MNRAS, 398, 1041 [NASA ADS] [CrossRef] [Google Scholar]
- Clemens, J. C., Crain, J. A., & Anderson, R. 2004, SPIE Conf. Ser., 5492, 331 [NASA ADS] [Google Scholar]
- Coleiro, A., Chaty, S., Zurita Heras, J. A., Rahoui, F., & Tomsick, J. A. 2013, A&A, 560, A108 [NASA ADS] [CrossRef] [EDP Sciences] [Google Scholar]
- Coppejans, R., Gulbis, A. A. S., Kotze, M. M., et al. 2013, PASP, 125, 976 [Google Scholar]
- Cutri, R. M., Skrutskie, M. F., van Dyk, S., et al. 2003, 2MASS All Sky Catalog of point sources (NASA/IPAC Infrared Science Archive) [Google Scholar]
- Dempsey, R. C., Linsky, J. L., Fleming, T. A., & Schmitt, J. H. M. M. 1993, ApJS, 86, 599 [NASA ADS] [CrossRef] [Google Scholar]
- Evans, P. A., Page, K. L., Osborne, J. P., et al. 2020, ApJS, 247, 54 [Google Scholar]
- Filipović, M. D., Dai, S., Arbutina, B., et al. 2023, AJ, 166, 149 [CrossRef] [Google Scholar]
- Filipović, M. D., Lazarević, S., Araya, M., et al. 2024, PASA, 41, e112 [Google Scholar]
- Filipović, M. D., & Tothill, N. F. H. 2021, Multimessenger Astronomy in Practice (IOP Publishing) [Google Scholar]
- Freund, S., Czesla, S., Predehl, P., et al. 2024, A&A, 684, A121 [NASA ADS] [CrossRef] [EDP Sciences] [Google Scholar]
- Gaia Collaboration (Vallenari, A., et al.) 2023, A&A, 674, A1 [NASA ADS] [CrossRef] [EDP Sciences] [Google Scholar]
- Güver, T., & Özel, F. 2009, MNRAS, 400, 2050 [Google Scholar]
- Guzman, J., Whiting, M., Voronkov, M., et al. 2019, Astrophysics Source Code Library [record ascl:1912.003] [Google Scholar]
- Hénault-Brunet, V., Oskinova, L. M., Guerrero, M. A., et al. 2012, MNRAS, 420, L13 [NASA ADS] [Google Scholar]
- H.E.S.S. Collaboration (Aharonian, F., et al.) 2022, Science, 376, 77 [NASA ADS] [CrossRef] [Google Scholar]
- Hobbs, G., Manchester, R. N., Dunning, A., et al. 2020, PASA, 37, e012 [NASA ADS] [CrossRef] [Google Scholar]
- Hopkins, A., Kapinska, A., Marvil, J., et al. 2025, PASA, 42, e071 [Google Scholar]
- Hotan, A. W., Bunton, J. D., Chippendale, A. P., et al. 2021, PASA, 38, e009 [NASA ADS] [CrossRef] [Google Scholar]
- Hui, C. Y., & Li, K. L. 2019, Galaxies, 7, 93 [NASA ADS] [CrossRef] [Google Scholar]
- Hurley-Walker, N., Hancock, P., Franzen, T., et al. 2019, PASA, 36, e047 [NASA ADS] [CrossRef] [Google Scholar]
- Ivanova, N., Heinke, C. O., Rasio, F. A., Belczynski, K., & Fregeau, J. M. 2008, MNRAS, 386, 553 [NASA ADS] [CrossRef] [Google Scholar]
- Jonas, J., & MeerKAT Team. 2016, in MeerKAT Science: On the Pathway to the SKA, 1 [Google Scholar]
- Kargaltsev, O., & Pavlov, G. G. 2008, in AIP Conf. Ser., 983, 40 Years of Pulsars: Millisecond Pulsars, Magnetars and More, 171 [Google Scholar]
- Kato, M., Saio, H., & Hachisu, I. 2022, PASJ, 74, 1005 [Google Scholar]
- Kitaura, F. S., Janka, H. T., & Hillebrandt, W. 2006, A&A, 450, 345 [NASA ADS] [CrossRef] [EDP Sciences] [Google Scholar]
- Kothes, R. 2017, in Astrophys. Space Sci. Libr., 446, Modelling PWNe, 1 [Google Scholar]
- Kurtz, M. J., Eichhorn, G., Accomazzi, A., et al. 2000, A&AS, 143, 41 [Google Scholar]
- Lin, J., Rappaport, S., Podsiadlowski, P., et al. 2011, ApJ, 732, 70 [NASA ADS] [CrossRef] [Google Scholar]
- Lovegrove, E., & Woosley, S. E. 2013, ApJ, 769, 109 [NASA ADS] [CrossRef] [Google Scholar]
- Maitra, C., Haberl, F., Maggi, P., et al. 2021, MNRAS, 504, 326 [NASA ADS] [CrossRef] [Google Scholar]
- Merloni, A., Lamer, G., Liu, T., et al. 2024, A&A, 682, A34 [NASA ADS] [CrossRef] [EDP Sciences] [Google Scholar]
- Misiriotis, A., Xilouris, E. M., Papamastorakis, J., Boumis, P., & Goudis, C. D. 2006, A&A, 459, 113 [NASA ADS] [CrossRef] [EDP Sciences] [Google Scholar]
- Nomoto, K. 1987, ApJ, 322, 206 [NASA ADS] [CrossRef] [Google Scholar]
- Norris, R. P., Marvil, J., Collier, J. D., et al. 2021, PASA, 38, e046 [NASA ADS] [CrossRef] [Google Scholar]
- Pastorello, A., & Fraser, M. 2019, Nat. Astron., 3, 676 [Google Scholar]
- Podsiadlowski, P., Langer, N., Poelarends, A. J. T., et al. 2004, ApJ, 612, 1044 [NASA ADS] [CrossRef] [Google Scholar]
- Ransom, S. M., Eikenberry, S. S., & Middleditch, J. 2002, AJ, 124, 1788 [Google Scholar]
- Rodriguez, J., Tomsick, J. A., & Chaty, S. 2008, A&A, 482, 731 [NASA ADS] [CrossRef] [EDP Sciences] [Google Scholar]
- Smith, D. A., Abdollahi, S., Ajello, M., et al. 2023, ApJ, 958, 191 [NASA ADS] [CrossRef] [Google Scholar]
- Stritzinger, M. D., Taddia, F., Fraser, M., et al. 2020, A&A, 639, A103 [NASA ADS] [CrossRef] [EDP Sciences] [Google Scholar]
- Thompson, T. A., Prieto, J. L., Stanek, K. Z., et al. 2009, ApJ, 705, 1364 [NASA ADS] [CrossRef] [Google Scholar]
- Vilhu, O. 1984, A&A, 133, 117 [NASA ADS] [Google Scholar]
- Vink, J., Bleeker, J., van der Heyden, K., et al. 2006, ApJ, 648, L33 [Google Scholar]
- Vink, J., Bamba, A., & Yamazaki, R. 2011, ApJ, 727, 131 [NASA ADS] [CrossRef] [Google Scholar]
- Wenger, M., Ochsenbein, F., Egret, D., et al. 2000, A&AS, 143, 9 [NASA ADS] [Google Scholar]
- Williams, B. J., Blair, W. P., Blondin, J. M., et al. 2011, ApJ, 741, 96 [Google Scholar]
- Wright, E. L., Eisenhardt, P. R. M., Mainzer, A. K., et al. 2010, AJ, 140, 1868 [Google Scholar]
- Wright, N. J., Drake, J. J., Mamajek, E. E., & Henry, G. W. 2011, ApJ, 743, 48 [Google Scholar]
The nearest X-ray source in the eRASS1 catalogue lies ~2′ from 1eRASS J111821.2-543729, while the closest neighbour of the 2SXPS J111821.3-543733 in the Swift catalogue is 3.2′ away.
Build Swift XRT products
HEAVENS online tool
eROSITA-DE DR1
p = 1 - e(−λA), where λ is the local surface density of sources, and A is the considered search area.
 , where E = 1051 erg is the explosion energy, ρ is the ambient density, RSNR is the radius of the remnant, and α is a numerical factor of order unity.
EMU Project page
CSIRO ASKAP Science Data Archive (CASDA)
S ∝ να, where S is the flux density, νis the observing frequency, and α is the spectral index.
PRESTO: a search technique for binary pulsars
Parkes Pulsar Data Archive (PPDA)
Appendix A ASKAP-EMU observations and processing
The Australian Square Kilometre Array Pathfinder (ASKAP; Hotan et al. 2021) is a radio interferometer located at Inyarri-manha Ilgari Bundara, the CSIRO Murchison Radio-astronomy Observatory in Western Australia. The array consists of 36 fixed 12 m antennas, with baselines ranging from 22 m to 6.4 km. Each antenna is equipped with a phased array feed (PAF) at the primary focus, forming 36 beams simultaneously and providing a large field of view of ∼25-30 deg2. This design makes ASKAP a powerful instrument for conducting large-area radio surveys.
We used archival data from ASKAP’s deep radio-continuum survey, the Evolutionary Map of the Universe (EMU8; Norris et al. 2021; Hopkins et al. 2025), which aims to produce a comprehensive atlas of the southern sky and is currently expected to be completed in 2028. EMU observations are centred at 944MHz with a bandwidth of 288 × 1 MHz channels. Standard observations have a full 10 h track, achieving a typical sensitivity of 25-30 μJy beam−1. Data processing is performed using the ASKAPsoft pipeline (Guzman et al. 2019). The final data products are available through the CSIRO ASKAP Science Data Archive (CASDA9), under project code AS201.
Appendix B EMU data products
The EMU survey produces three main types of full-band images for each field: conv, raw, and highres. The standard images, identified by the conv suffix in the filename, have a uniform resolution of 15″, ensuring consistent flux density measurements across the survey. The raw images have the native beam, resulting in higher resolution (∼11″-13″), but variations in beam size across a field make flux density measurements less reliable. The highres images are produced using uniform weighting and achieve even higher resolution (∼7″-9″). While these images enhance fine structure in bright emission, they suffer from reduced sensitivity to diffuse emission and are therefore unsuitable for quantitative flux-density analysis.
For this work, we used the recommended conv image for Fig. 1 and for the quantitative analysis of G289.6+5.8. We also examined the corresponding highres image, which has a significantly higher resolution of ∼7.1″ × 7.9″. Both the conv and highres images are shown in Fig. 2. As expected, flux inconsistencies arise from reduced sensitivity of the highres images to diffuse emission. The highres data reveals a point source in the northeast of the central nebula at (R.A., Dec)J2000 = 11:18:21.27, −54:37:29.88. The peak, ASKAP J1118-5437, positionally coincides with the Gaia32, 1eRASS J111821.2-543729, and 2MASS J11182121-5437286 sources. In addition, the high-res contours highlight a secondary peak toward the southwest; however, this feature does not resemble a compact source and is likely caused by flux fluctuations inherent to this data product.
Appendix C Spectral analysis methods
To constrain the spectral shape and derive the spectral indices, flux density measurements at multiple widely separated frequencies are typically required. However, flux density measurements for G289.6+5.8 were only available from the EMU survey. In this case, we used two in-band methods: sub-band imaging and the Taylor term technique. Both methods are limited to high signal-to-noise, so we restricted our analysis to the central region and the brightest northeastern filamentary structures.
Sub-band imaging. We used image cubes with a total bandwidth of 288 MHz, covering the frequency range from 800 to 1088 MHz at 1 MHz resolution. The calibrated visibilities from beams that cover G289.6+5.8 were split into four 72MHz spectral windows, and reprocessed using ASKAPsoft (Guzman et al. 2019). The resulting sub-band images were primary beam-corrected, mosaicked, and convolved to a common resolution of 18″ × 18″. These final images are centred at reference frequencies of 835, 908, 980, and 1051 MHz.
Following the method described in Ball et al. (2023), we measured the integrated flux density of the central region of G289.6+5.8 using POLYGON_FLUX software (Hurley-Walker et al. 2019). Flux densities were extracted from three polygonal regions defined by cyan contour levels shown in Fig. 2 and fitted with a simple power law model to derive radio spectral indices10. The resulting spectral indices are −0.51 ± 0.26, −0.38 ± 0.18 and −0.28 ± 0.10 for the outer, middle and inner polygons, respectively. The derived values are summarised in Table C.1. For the brightest filament segments to the northeast, we derived spectral indices of −0.76 ± 0.56 for the outer filament and −0.56 ± 0.32 for the inner filament.
Taylor term technique. ASKAPsoft models the wide-band sky brightness distribution as a Taylor series expansion in frequency, producing a set of Taylor-coefficient images (Hotan et al. 2021 ; Norris et al. 2021). We used the first two terms: the zeroth-order term T0, representing the total intensity integrated over the observing band, and the first-order term T1, which describes the frequency dependence of the intensity. Assuming a power-law spectrum10, the spectral index was computed as α = T1/T0.
We generated the Taylor term images from the same calibrated visibilities used in the sub-band imaging, and convolved to a common resolution of 18″ × 18″ to allow a direct comparison. To suppress noise artefacts in low signal-to-noise regions, we applied a 3σ flux density mask based on T0 image.
Using the same polygon regions as in the previous method, we derived mean spectral indices of −0.51 ± 0.20, −0.34 ± 0.10, and −0.22 ± 0.10 for the outer, middle, and inner regions of the central source (Table C.1), respectively, and −0.71 ± 0.45 and −0.59 ± 0.40 for the bright northeastern, outer and inner, filaments.
Flux densities and spectral indices of the central nebula.
Appendix D Optical observations
Optical spectroscopy of Gaia 32 was obtained with the 4.1 m Southern Astrophysical Research (SOAR) Telescope located on Cerro Pachón in Chile, using the Goodman longslit spectrograph (Clemens et al. 2004). The observations were carried out in two epochs on 21 June and 24 July 2025 (PI: I. El Mellah). During each epoch, we acquired two spectra using the 400 M2 grism mounted on the RED camera with a 1″ slit and 2 × 2 binning, providing wavelength coverage from 5000 to 9050 Â, and a 3-pixel spectral resolution of 13 Â. Each exposure had an integration time of 600 s.
During the second observing epoch, we used two different slit orientations to minimise contamination from nearby sources. The data were reduced using the Goodman spectroscopic pipeline, including standard flat-field and arc calibrations. One-dimensional spectra were extracted from the reduced twodimensional frames produced by the pipeline and combined within each epoch. Flux calibration was performed using a spectrophotometric standard star observed during the same night, with atmospheric extinction corrections derived from the accompanying g- and r-band acquisition images.
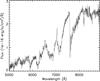 |
Fig. D.1 SOAR optical spectrum of Gaia 32 with a total integration time of 3600 s. |
The combined spectrum shows clear photospheric features of a cool star, including prominent molecular absorption bands, such as TiO and VO. By comparison with archival spectral models (e.g. BT-Settl; Allard et al. 2011), we estimated a spectral type of M3 with an effective temperature of Teff ≈ 3200-3300 K and a line of sight extinction of AV ≈ 0.5-0.6 mag. The spectral classification was primarily based on the flux ratios outside and inside the TiO absorption bands. The spectrum is presented in Fig. D.1.
Optical photometry of Gaia 32 was obtained on 22 June, 29 June, and 11 July 2025, using the SHOC cameras (Coppejans et al. 2013) mounted on the 1.9 m and 1.0 m telescopes at the South African Astronomical Observatory (SAAO). Exposures were triggered by a GPS-controlled timing system to ensure precise time stamps. Observations were taken using an R (22 June), r′ (29 June), and clear (11 July) filters, with each observing run lasting approximately 3 h. Differential photometry was performed for the target using nearby comparison stars within the same field of view to search for variability, following standard aperture-photometry procedures. As with the spectroscopic observations, the photometric analysis was affected by contamination from a nearby bright star (Fig. D.2), which limited the sensitivity to small-amplitude variability.
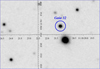 |
Fig. D.2 Near-IR J-band image of the field around IGR J11187-5438, retrieved from the ESO Science Archive. The image was obtained with the VIRCAM instrument mounted on the ESO VISTA telescope on 7 December 2013 under 1″ seeing conditions, with an astrometric rms 0.05″. The blue circle (r = 2.5″) is centred on the Gaia 32 (Table 1). The image is shown on a linear scale. |
Appendix E Pulsar search with Murriyang
Following the discovery, we carried out a deep pulsar search observation of the central region of G289.6+5.8 using Murriyang, the CSIRO’s Parkes radio telescope, with the Ultra-Wideband Low (UWL) receiver in conjunction with the Medusa backend (Hobbs et al. 2020). The observation was obtained on 20 October 2023 under project code P1238 (PI: A. Ahmad). The total integration time was 12 545 s, recording total-intensity data only. The data were acquired in pulsar search mode with 2-bit sampling at a time resolution of 64 μs and frequency channels with a width of 0.125 MHz, resulting in 26 624 channels covering the frequency range 704-4032 MHz.
We segmented the UWL data into three frequency subbands. The lowest part of the UWL band (below 1344 MHz) was heavily contaminated by radio frequency interference (RFI) and therefore excluded from the analysis. The remaining data were analysed in two bands, with a mid-band ranging from 1344-2112 MHz (centred at 1728 MHz), and a high-band ranging from 2112-3520 MHz (centred at 2816 MHz). The mid-band provides good sensitivity to low dispersion measure (DM) pulsars with steep spectra, while the higher-frequency band reduces the effects of DM smearing and scattering, improving sensitivity to high-DM pulsars.
A periodicity search was performed using the pulsar search software package PRESTO11 (Ransom et al. 2002), covering a DM range of 0-2000 pc cm−3. RFI was mitigated using the rfifind routine. To account for potential orbital modulation, we searched for signals, allowing them to drift by up to ±200∕nh bins in the Fourier domain by setting zmax = 200, where nh is the highest detected harmonic (up to eight harmonics were summed). Candidates with a signal-to-noise ratio greater than 8 were folded and inspected visually. No pulsations were detected in either frequency band. The data are publicly available through the Parkes Pulsar Data Archive12.
All Tables
Observed X-ray fluxes of the CSRN measured with INTE-GRALIBIS/ISGRI, Swift BAT, Swift XRT, and eROSITA (eRASS1).
All Figures
|
Fig. 1 Composite RGB image of G289.6+5.8 showing the large-scale radio structure of the remnant. The image combines the ASKAP-EMU 944 MHz total intensity map (red and blue) with WISE 12 μm emission (green). To emphasise the structure of the source, the radio image is displayed in two different scalings: the red layer uses a linear stretch to highlight the bright filaments and central region, and the blue layer uses a logarithmic stretch to enhance the low surface brightness emission. The 15" synthesised beam is shown in the lower left corner. The γ-ray source IGR J11187-5438 lies within the compact nebula at the centre of the shell. |
| In the text | |
|
Fig. 2 ASKAP-EMU view of the central region of G289.6+5.8. Panel a: standard conv image. Panel b: higher-resolution highres image. The conv image has a uniform resolution of 15″ × 15″, while the highres image has a resolution of 7.9″ × 7.1″. The synthesised beam sizes are given in the lower left corners. The cyan contours correspond to the conv image at levels of 0.625, 1 and 1.5 mJy beam−1. The black contours trace the highres image at 0.4, 0.5 and 0.55 mJy beam−1 levels. The coloured circles mark the sources listed in Table 1, and the circle radii indicate their positional uncertainties. The inset in panel b shows a zoomed-in view of the boxed region surrounding these sources. |
| In the text | |
|
Fig. 3 Top: broad-band X-ray spectrum of the CSRN obtained with eROSITA (blue), Swift XRT (black), Swift BAT (green), and INTEGRAL IBIS/ISGRI (red). The solid line shows the best-fitting absorbed power-law model. Bottom: Ratio of the data to the model. |
| In the text | |
|
Fig. D.1 SOAR optical spectrum of Gaia 32 with a total integration time of 3600 s. |
| In the text | |
|
Fig. D.2 Near-IR J-band image of the field around IGR J11187-5438, retrieved from the ESO Science Archive. The image was obtained with the VIRCAM instrument mounted on the ESO VISTA telescope on 7 December 2013 under 1″ seeing conditions, with an astrometric rms 0.05″. The blue circle (r = 2.5″) is centred on the Gaia 32 (Table 1). The image is shown on a linear scale. |
| In the text | |
Current usage metrics show cumulative count of Article Views (full-text article views including HTML views, PDF and ePub downloads, according to the available data) and Abstracts Views on Vision4Press platform.
Data correspond to usage on the plateform after 2015. The current usage metrics is available 48-96 hours after online publication and is updated daily on week days.
Initial download of the metrics may take a while.