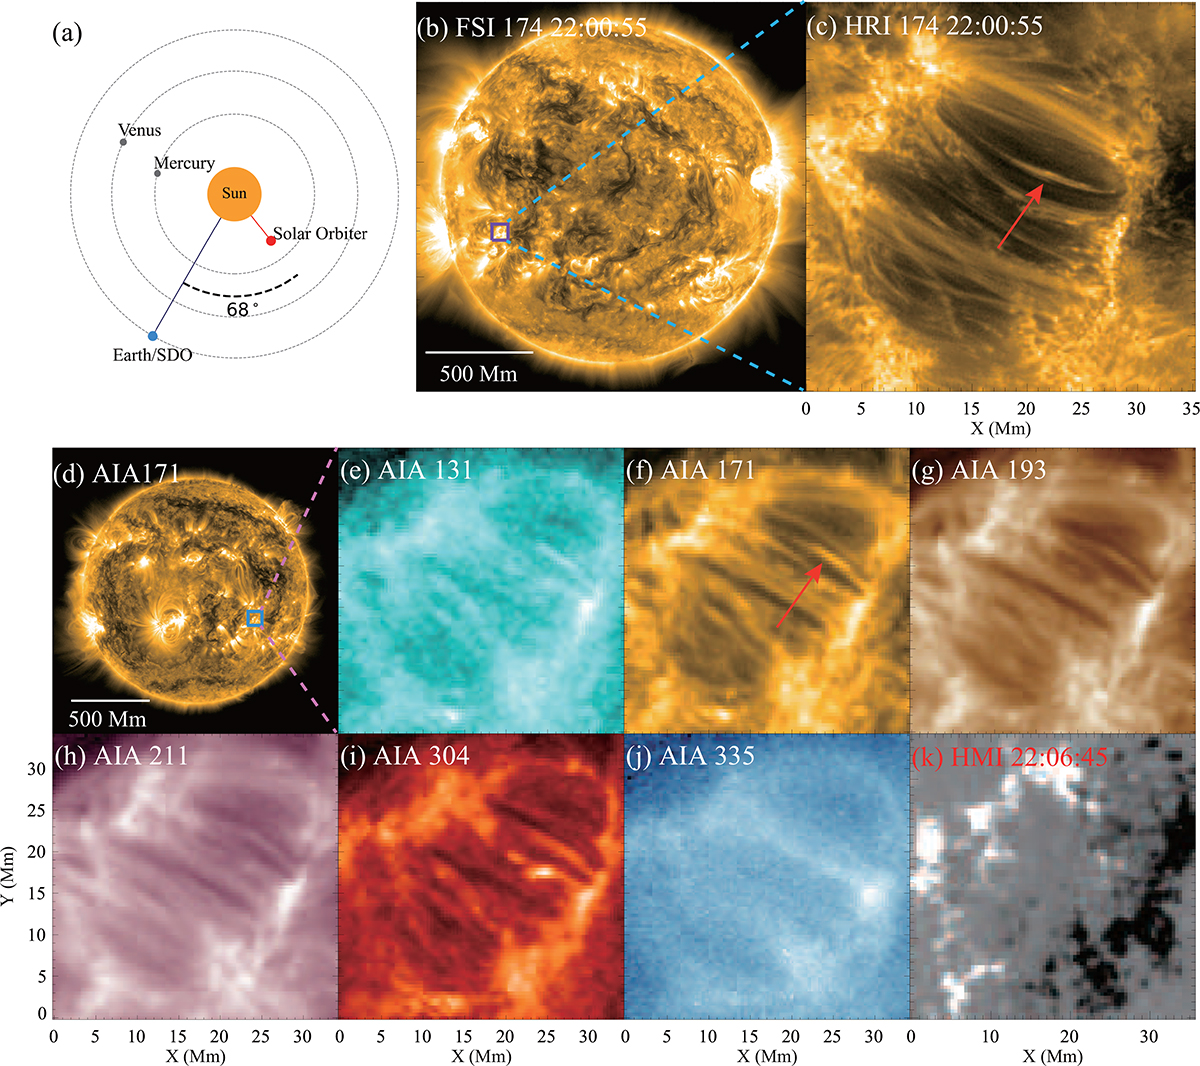
Fig. 1.
Download original image
Overview of the study. Panel (a) shows the observation positions of SDO and SO. Panel (b) presents the full disk of the Sun in EUI 174 Å passband, of which the purple box indicates the ROI location in the HRI field of view, situated near the equatorial region on the left side of the solar surface. Panel (c) is the ROI in a high-resolution image of the HRIEUV passband. Panel (d) shows the full disk of the Sun in AIA 171 Å passband, of which the blue box marks the ROI position in the AIA field of view, located near the equatorial region on the right side of the solar surface. Panels (e)–(j) display the ROI images of AIA passbands, where multiple distinct loops connect the magnetic polarity regions in the upper left and lower right. Panel (k) shows the HMI magnetic field image of the ROI scaled from −300 G (black) to 300 G (white), with the primary positive polarity region in the upper left field of view, the main negative polarity region in the lower right, and numerous small-scale polarity points distributed in the central region.
Current usage metrics show cumulative count of Article Views (full-text article views including HTML views, PDF and ePub downloads, according to the available data) and Abstracts Views on Vision4Press platform.
Data correspond to usage on the plateform after 2015. The current usage metrics is available 48-96 hours after online publication and is updated daily on week days.
Initial download of the metrics may take a while.