Fig. 2.
Download original image
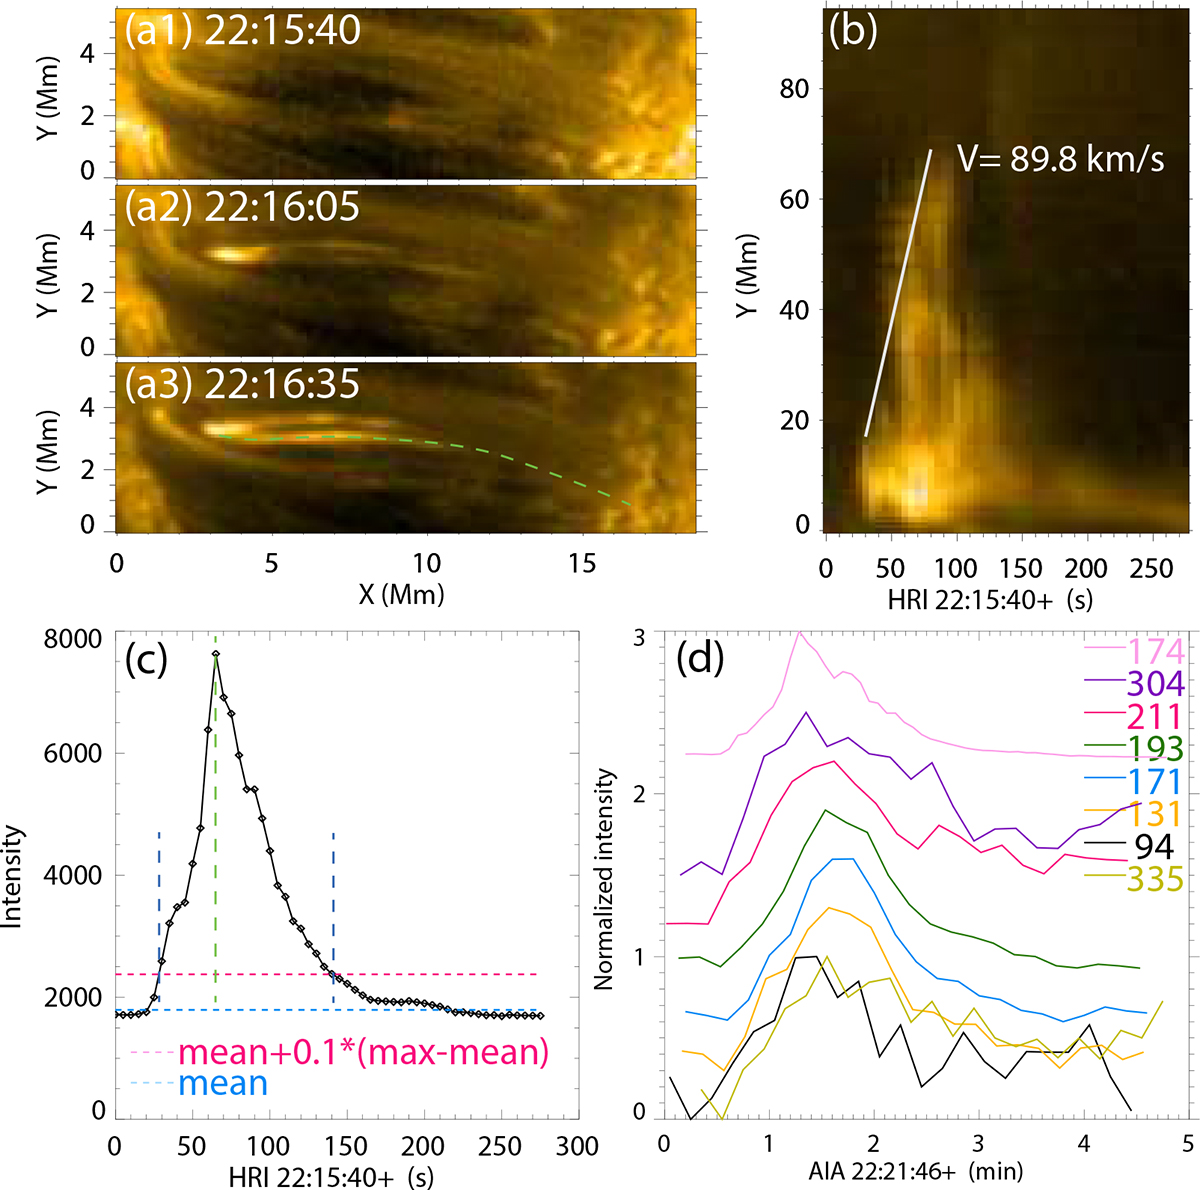
Case-analysis methodology. Panel (a) shows the evolution of Case-13. The dashed green line marks the trajectory of the brightening loop. Panel (b) presents the T–S map, constructed along the dashed green trajectory in panel a3; the solid white line indicates the propagation velocity of the brightening front. The T–S map was used to derive the characteristic timescale, Lb, propagation velocity, and other physical properties of the event. Panel (c) shows the schematic illustration of the timescale determination based on the light curve obtained by integrating the intensity along the selected loop path. The dashed blue line denotes the mean intensity of the lowest 50% of pixels, and the dashed red lines indicate the reference baseline used to identify the brightening and intensity decreasing phases. Panel (d) displays the light curves from multiple AIA passbands and the HRIEUV passband.
Current usage metrics show cumulative count of Article Views (full-text article views including HTML views, PDF and ePub downloads, according to the available data) and Abstracts Views on Vision4Press platform.
Data correspond to usage on the plateform after 2015. The current usage metrics is available 48-96 hours after online publication and is updated daily on week days.
Initial download of the metrics may take a while.