Fig. 3.
Download original image
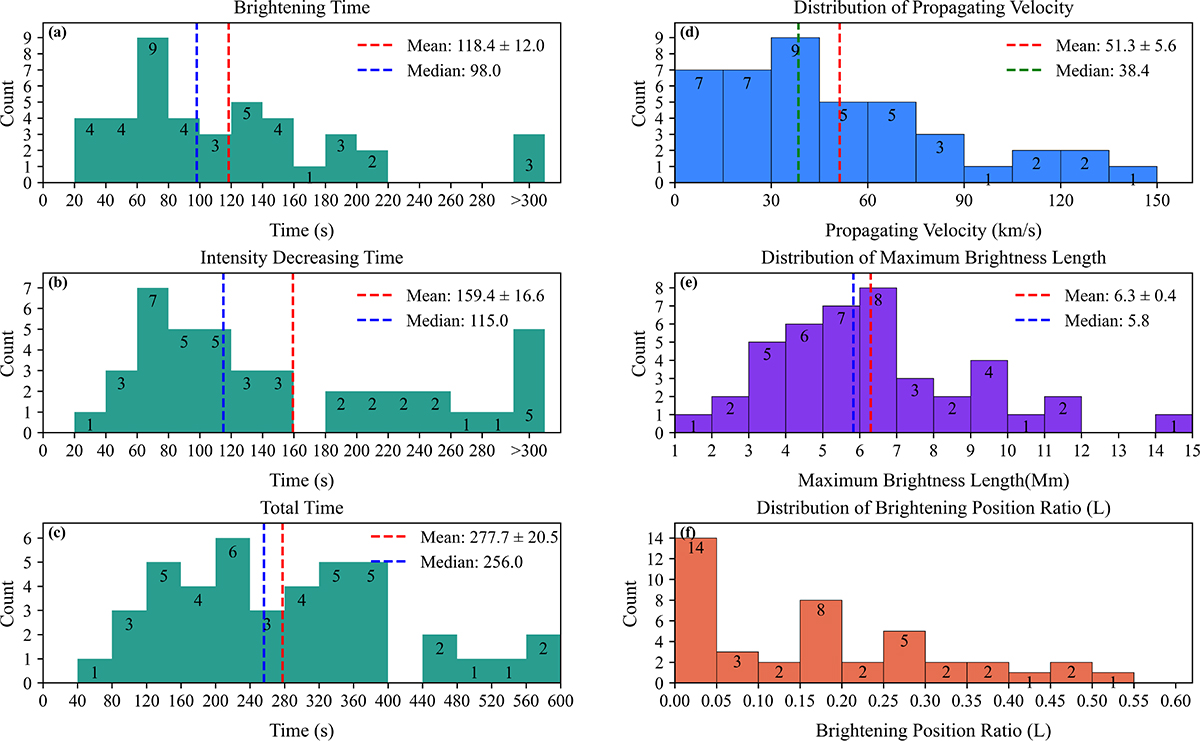
Statistical properties of 42 brightening events. Panels (a)–(c) show the distributions of the brightening time, intensity decreasing time, and total duration. The dashed red lines mark the mean values and the dashed blue lines mark the medians. Panel (d) shows the distribution of the propagation velocities of the brightening fronts. The dashed red and green lines denote the mean and median, respectively. Panel (e) displays the distribution of the maximum Lb, defined as the length of the contiguous brightened segment along the loop at the time of peak brightening. The dashed red and blue lines indicate the mean and median. Panel (f) presents the distribution of the initial brightening location, defined as the distance between the first clearly visible bright structure and the footpoint, normalized by the loop length. The detailed parameters of each event are listed in Table A.1.
Current usage metrics show cumulative count of Article Views (full-text article views including HTML views, PDF and ePub downloads, according to the available data) and Abstracts Views on Vision4Press platform.
Data correspond to usage on the plateform after 2015. The current usage metrics is available 48-96 hours after online publication and is updated daily on week days.
Initial download of the metrics may take a while.