Fig. 4.
Download original image
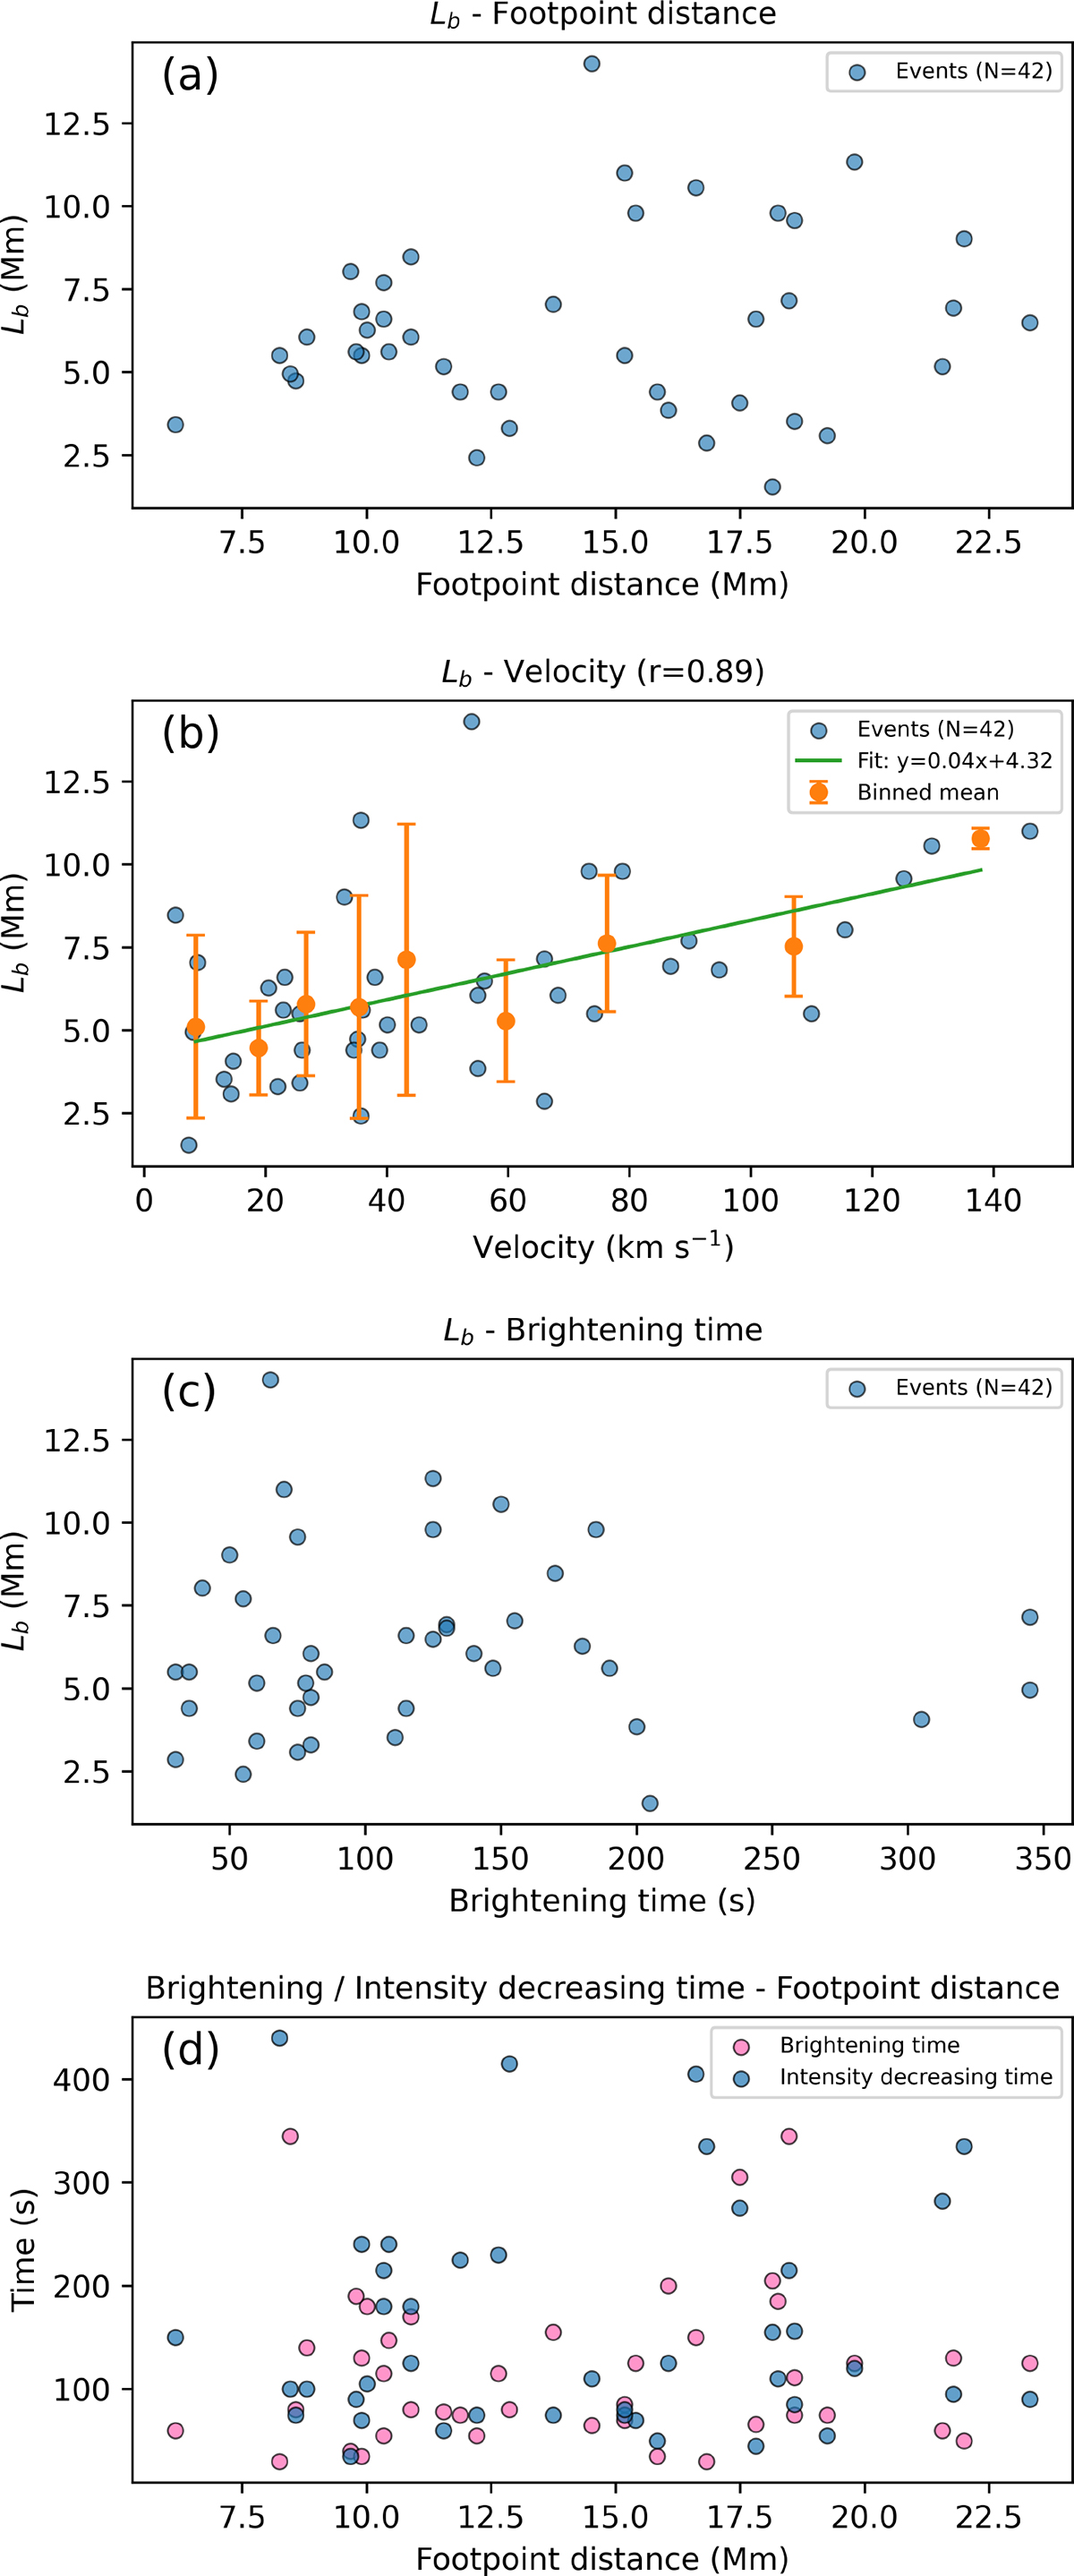
Two-dimensional correlation analysis. Panel (a) shows the correlation of Lb and the footpoint distance. Panel (b) displays the correlation of Lb and the propagation velocity. The solid green line was obtained from grouped mean data by linear fitting. Panel (c) presents the correlation of Lb and the brightening time. Panel (d) presents the correlation of the brightening and intensity decreasing time and footpoint distance. The pink dots represent the brightening time and the blue dots represent the intensity decreasing time.
Current usage metrics show cumulative count of Article Views (full-text article views including HTML views, PDF and ePub downloads, according to the available data) and Abstracts Views on Vision4Press platform.
Data correspond to usage on the plateform after 2015. The current usage metrics is available 48-96 hours after online publication and is updated daily on week days.
Initial download of the metrics may take a while.