Fig. 7.
Download original image
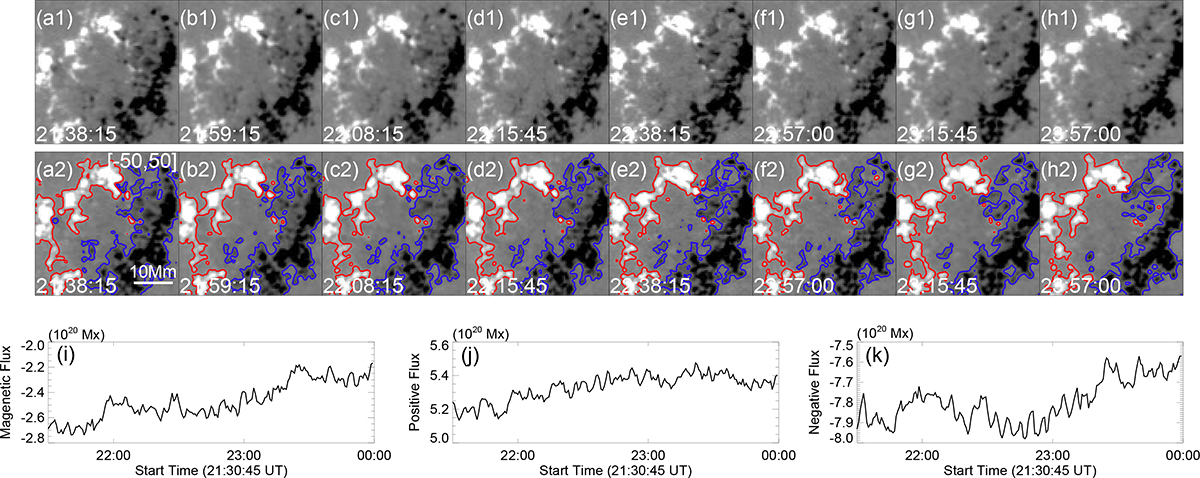
Magnetic field evolution. Panels (a1)–(h1) present the HMI magnetograms of the main region, where the brightening events occur. Panels (a2)–(h2) are the same as panel a, but overlaid with ±50 G magnetic field contours, facilitating the identification of magnetic polarity motion, emergence, and cancellation. Red and blue contours represent positive and negative magnetic polarities, respectively. Panels (i)–(k) show the temporal evolution of the total magnetic flux, positive magnetic flux, and negative magnetic flux of the region in panel a1.
Current usage metrics show cumulative count of Article Views (full-text article views including HTML views, PDF and ePub downloads, according to the available data) and Abstracts Views on Vision4Press platform.
Data correspond to usage on the plateform after 2015. The current usage metrics is available 48-96 hours after online publication and is updated daily on week days.
Initial download of the metrics may take a while.