Open Access
Fig. 4
Download original image
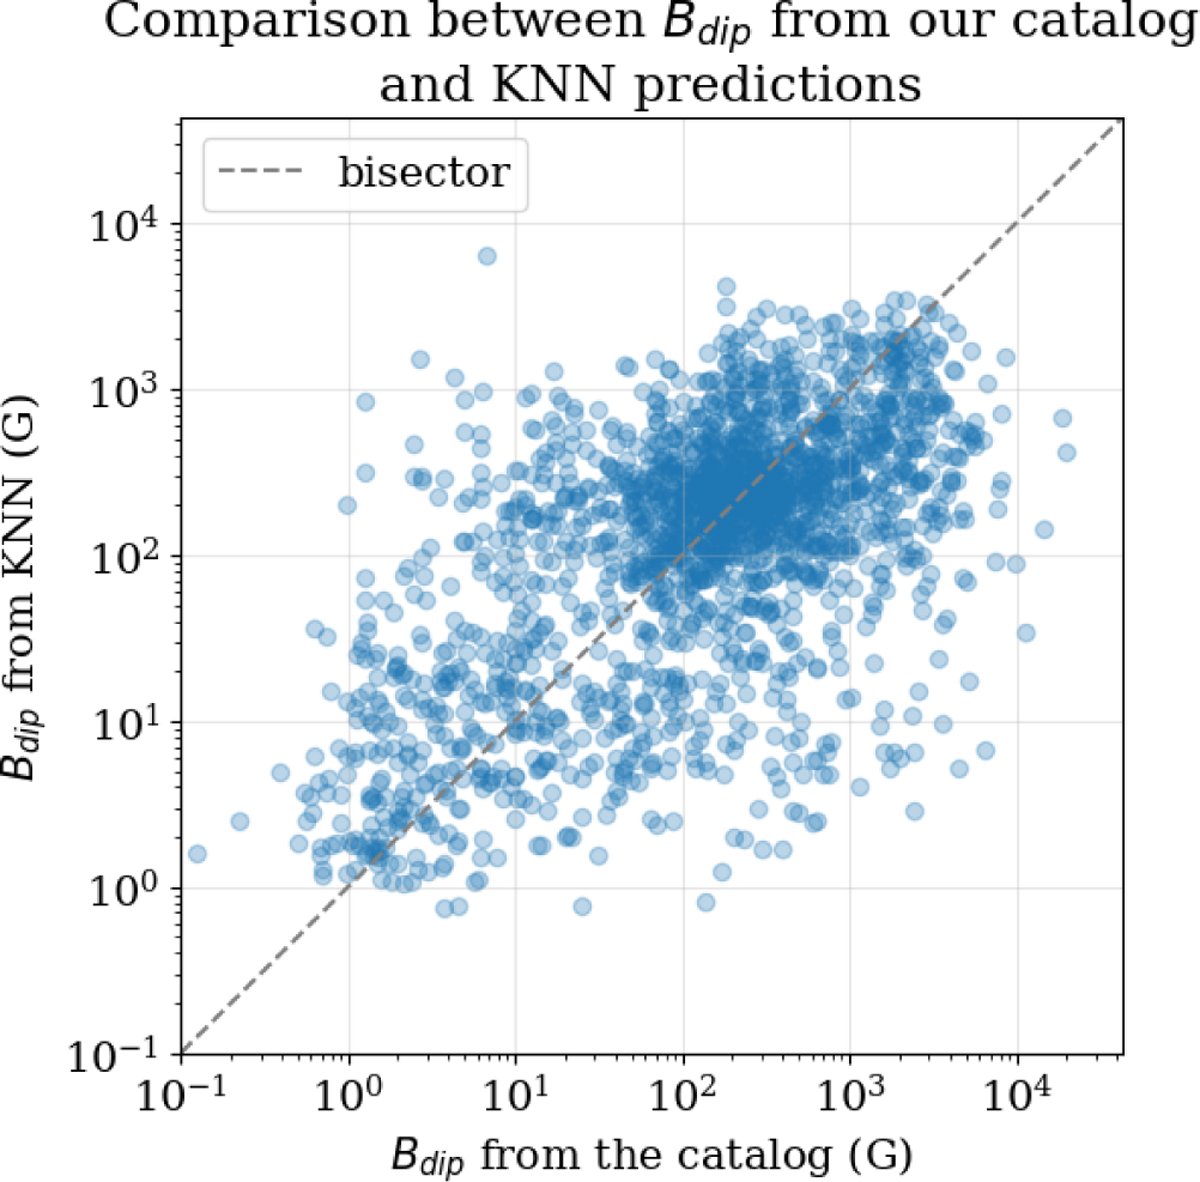
Values of Bdip,eq computed by the KNN method versus their actual measures. The dashed line indicates the first bisector.
Notes. Low Bdip,eq are mostly above the dashed line, and thus overestimated, while the bulk of high values (dark blue region) are slightly underestimated.
Current usage metrics show cumulative count of Article Views (full-text article views including HTML views, PDF and ePub downloads, according to the available data) and Abstracts Views on Vision4Press platform.
Data correspond to usage on the plateform after 2015. The current usage metrics is available 48-96 hours after online publication and is updated daily on week days.
Initial download of the metrics may take a while.