Fig. 1
Download original image
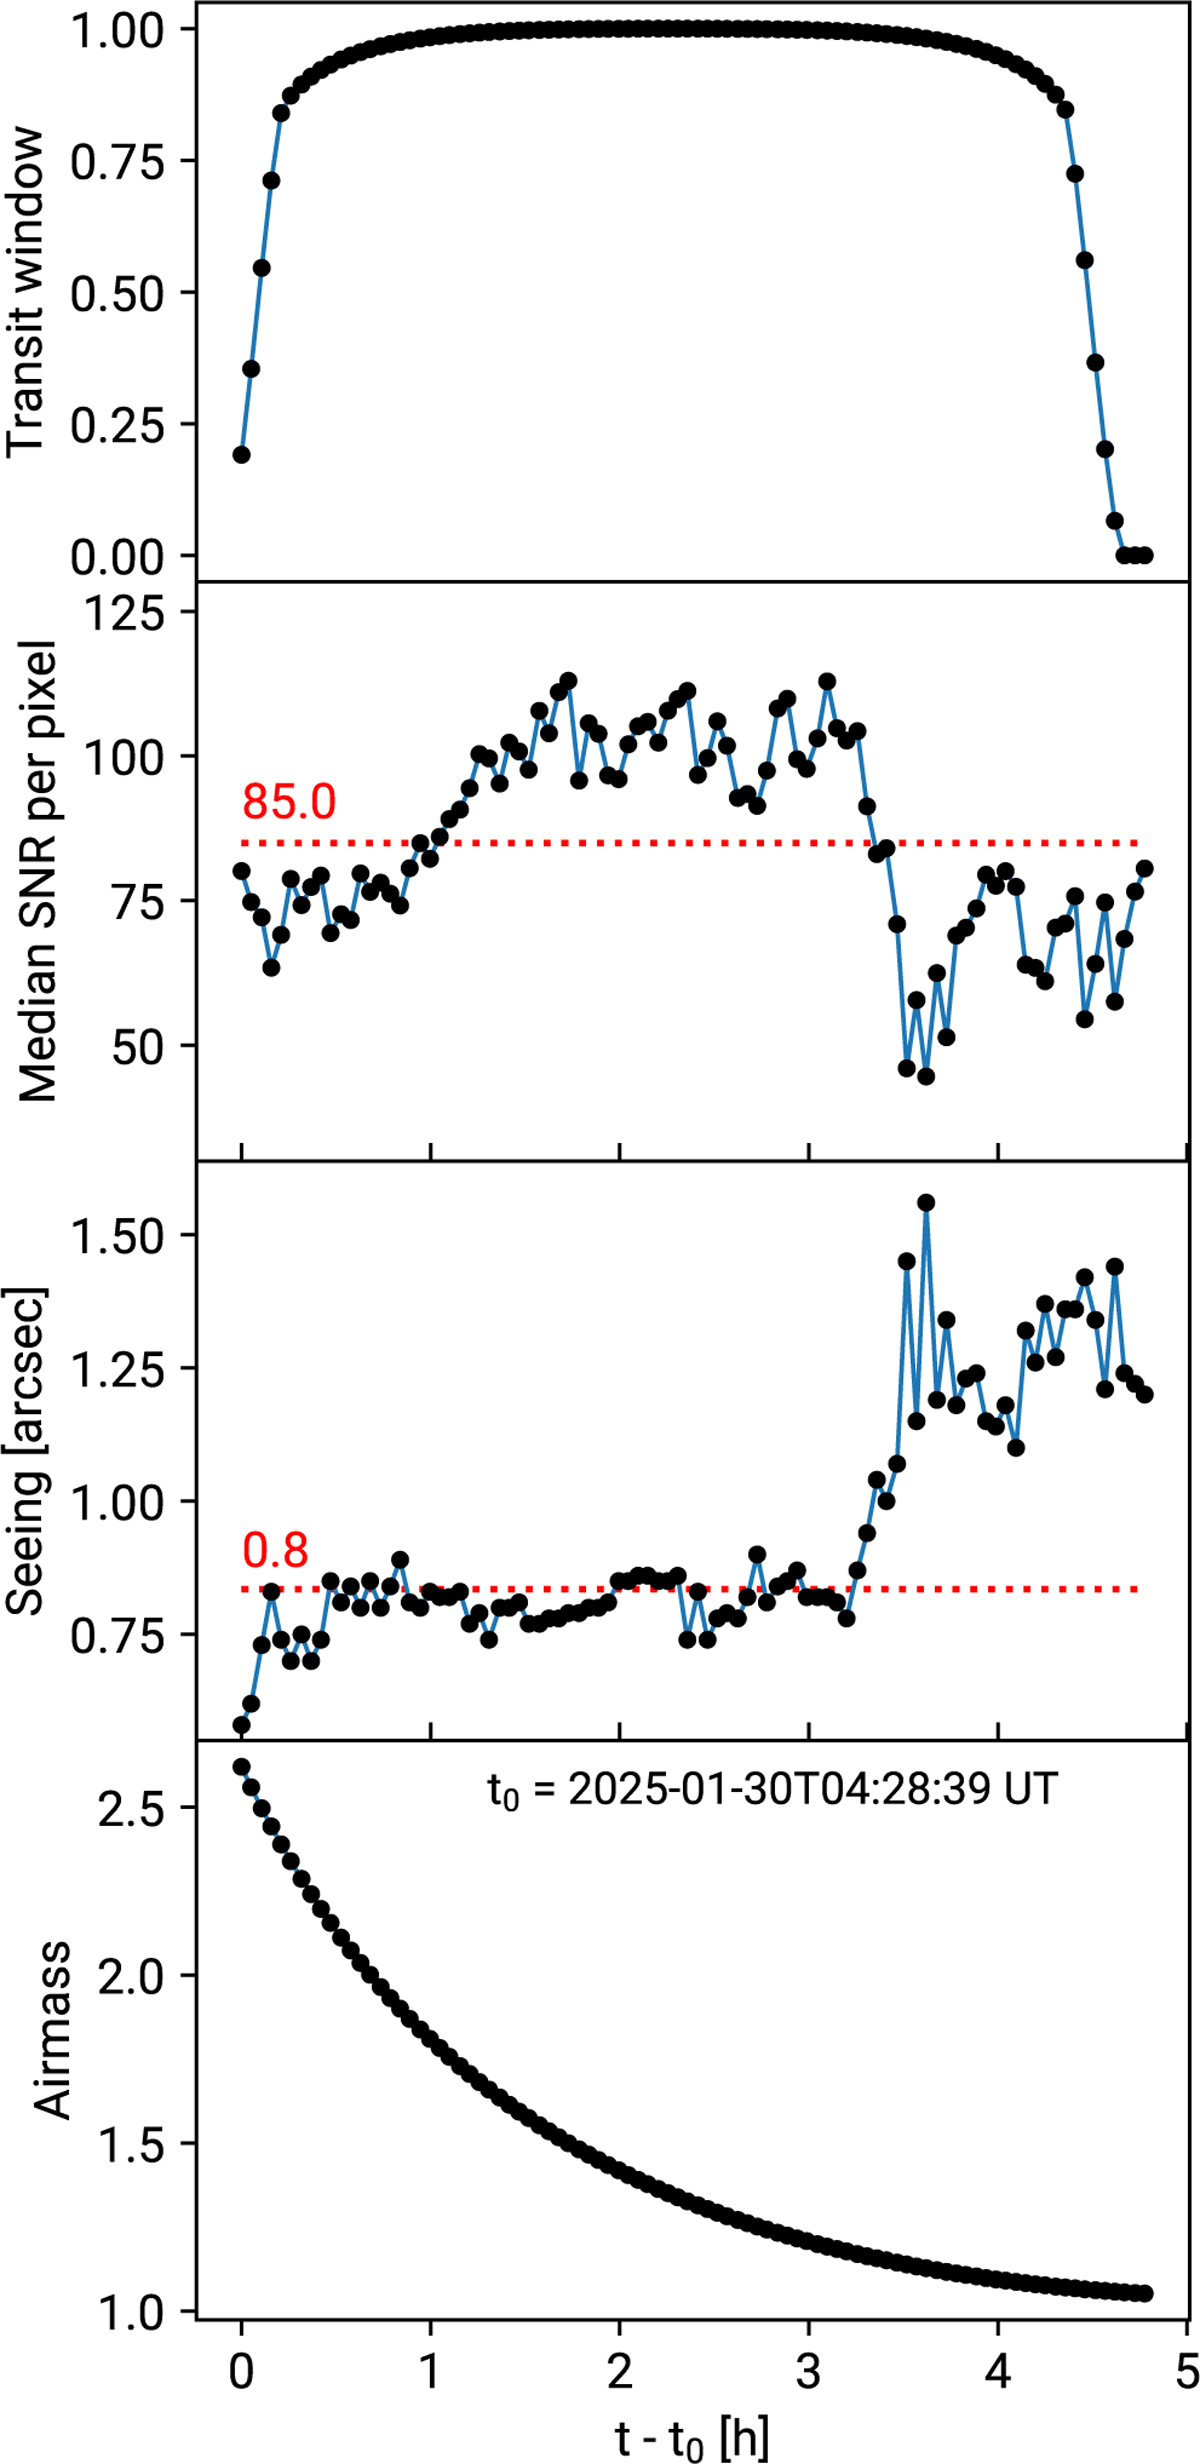
Evolution of the transit window, the median S/N per exposure, seeing, and airmass as a function of time from the first exposure. The median S/N and median seeing for the full time-series are indicated in red on the second and third panel respectively. The UT time at the start of the first exposure t0 is indicated on the fourth panel.
Current usage metrics show cumulative count of Article Views (full-text article views including HTML views, PDF and ePub downloads, according to the available data) and Abstracts Views on Vision4Press platform.
Data correspond to usage on the plateform after 2015. The current usage metrics is available 48-96 hours after online publication and is updated daily on week days.
Initial download of the metrics may take a while.